. 2023 Aug 16;131(8):087009. doi: 10.1289/EHP10831

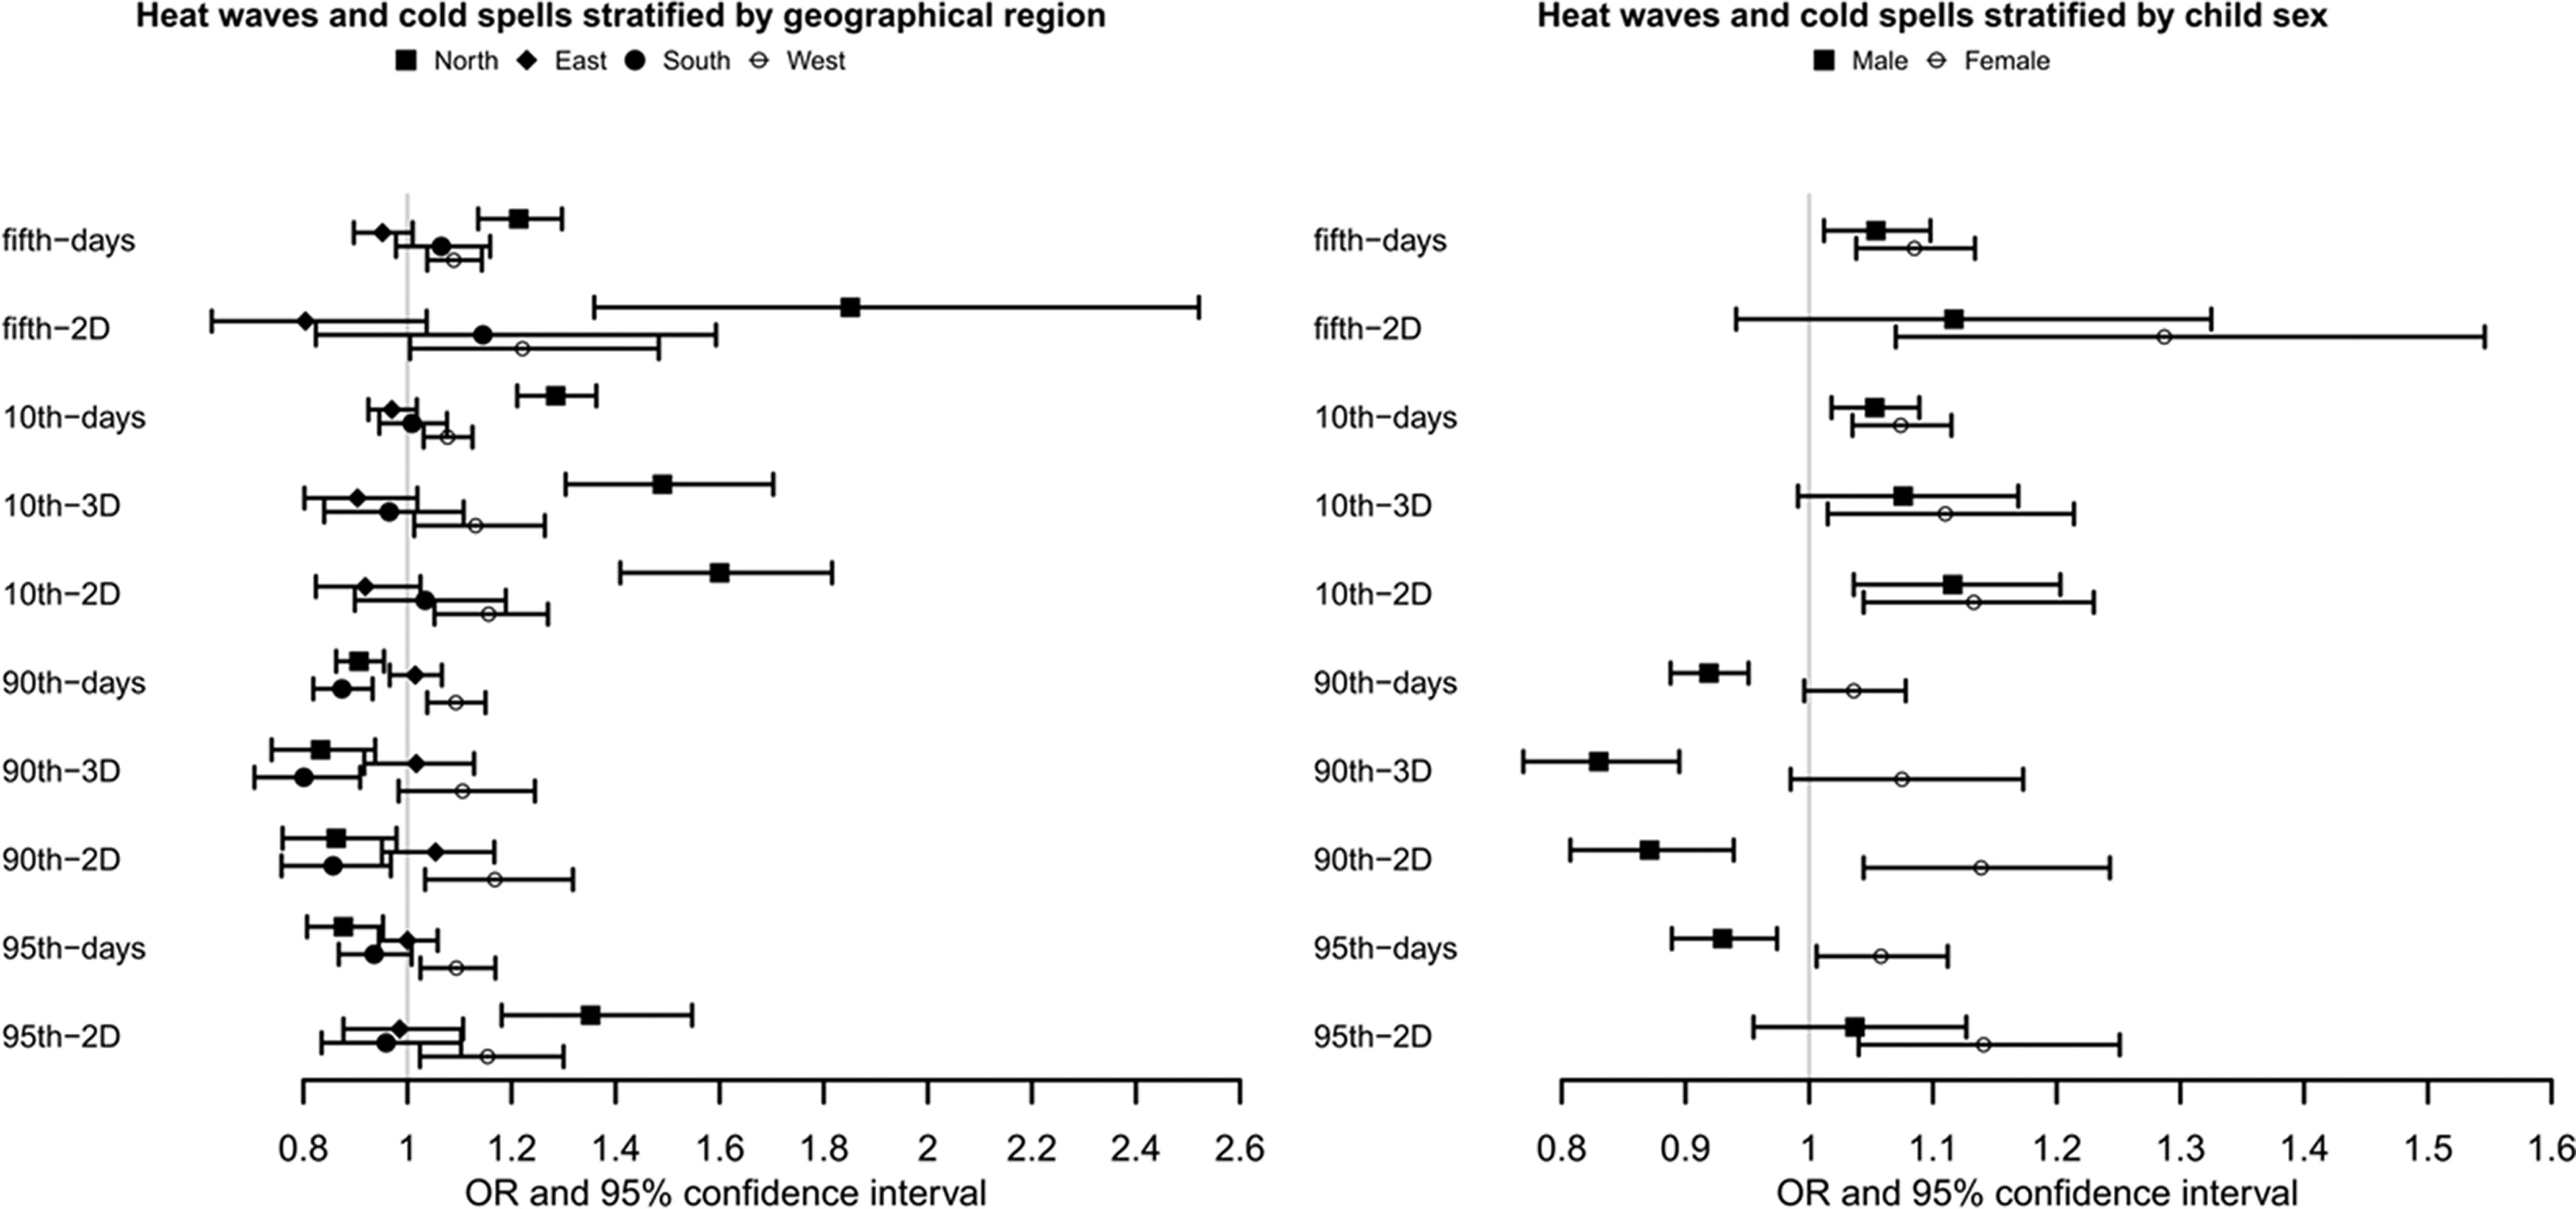
Figure 3.

Figure 3 is a set of two forest plots. On the left, the forest plot is titled heat waves and cold spells stratified by geographical region, plotting (bottom to top) ninety-fifth to 2 days; ninety-fifth to days; ninetieth to 2 days; ninetieth to 3 days; ninetieth to days; tenth to 2 days; tenth to 3 days, tenth to days; fifth to 2 days; and fifth to days (y-axis) across odds ratio and 95 percent confidence interval, ranging from 0.8 to 2.6 in increments of 0.2 (x-axis) for North, East South, and West. On the right, the forest plot is titled heat waves and cold spells stratified by child sex, plotting (bottom to top) ninety-fifth to 2 days; ninety-fifth to days; ninetieth to 2 days; ninetieth to 3 days; ninetieth to days; tenth to 2 days; tenth to 3 days, tenth to days; fifth to 2 days; and fifth to days (y-axis) across odds ratio and 95 percent confidence interval, ranging from 0.8 to 1.6 in in increments of 0.1 (x-axis) for male and female.

Associations of extreme climate events with preterm births in 1 wk before delivery in China Labor and Delivery Survey, stratified by geographical region and child sex. (See Tables S7 and S8 for corresponding numeric data.) Note: Generalized linear mixed model was used to examine the associations. Numbers of cases/observations in each stratum were: North (1,104/19,927), East (1,520/23,640), South (1,040/13,192), and West (1,301/14,059) for the geographical region and male (2,863/37,826), and female (2,083/32,872) for child sex. ORs represent a 1-unit increase in extreme weather events and are presented with a 95% CI. All models were adjusted for maternal age, maternal ethnicity, maternal education, insurance type, parity, GDP per capita, geographic region, conception season/child sex, conception year, PM2.5, and O3. CI, confidence interval; GDP, gross domestic product; OR, odds ratio; PM2.5, particulate matter with aerodynamic diameter 2.5μm.