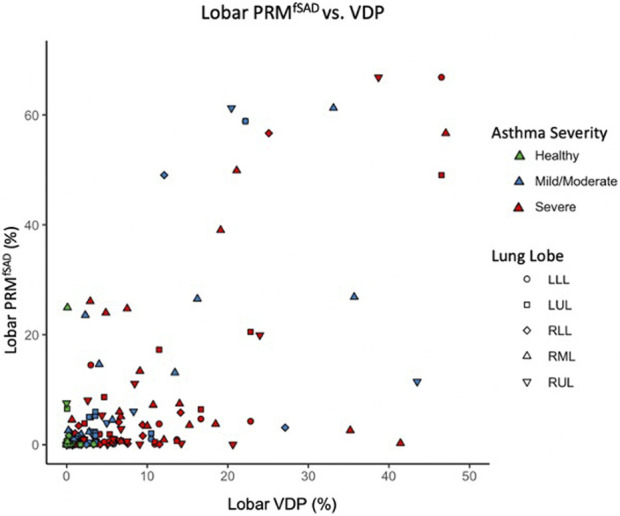
FIGURE 4.

Scatter plot comparing lobar VDP to average whole lung and lobar fSAD. Points are colored based on disease severity and their shapes classify what lobe the datapoint is from. LLL, left lower lobe; LUL, left upper lobe; RLL, right lower lobe; RML, right middle lobe; RUL, right upper lobe.
