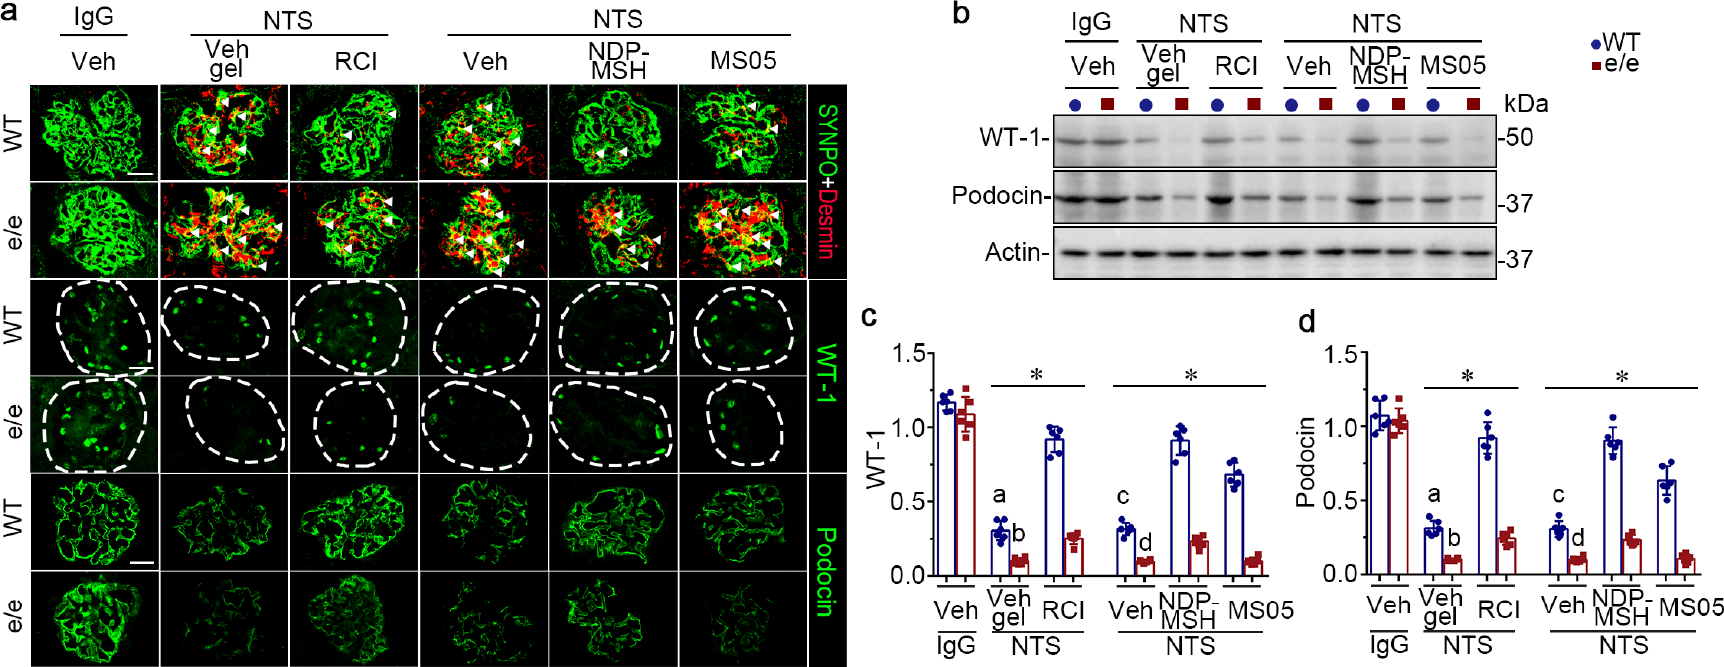
Figure 2. Melanocortin 1 receptor (MC1R) deficiency exacerbates podocyte injury in murine models of nephrotoxic serum (NTS) nephritis and blunts the protective efficacy of melanocortins.

(a) Animals were treated as shown in Figure 1. Representative micrographs show fluorescent immunohistochemistry staining of kidney specimens for indicated proteins, with glomeruli outlined by dashed circles. (bar=20 μm). White arrowheads indicate desmin expression in synaptopodin (SYNPO)-positive podocytes. (b) Representative blots show immunoblot analysis of isolated glomeruli for indicated proteins. (c, d) Estimation of the abundance of wilms’ tumor-1 (WT-1) and podocin expression by densitometric analyses of immunoblots, presented as relative levels normalized to actin. *P<0.05 by analysis of variance. aP<0.01 versus e/e (MC1R-null) group treated with NTS and Vehicle (Veh) gel or wild-type (WT) group with NTS and repository corticotropin injection (RCI) treatment; bP<0.01 versus e/e mice treated with NTS and RCI; cP<0.05 versus e/e mice treated with NTS and Veh or WT mice treated with NTS and pan-melanocortin receptor agonist [Nle, DPhe]-α-MSH (NDP-MSH) or MC1R agonist MS05 (custom-made peptide, GL Biochem); dP<;0.05 versus e/e mice treated with NTS and NDP-MSH; (n=6). To optimize viewing of this image, please see the online version of this article at www.kidney-international.org.
