. 2023 Aug 7;12:e88875. doi: 10.7554/eLife.88875

Figure 1. Deletion of Hsp31 paralogs induces protein glycation.

(A) Yeast phenotypic analysis. Cells were grown until the mid-log phase and harvested, subsequently treated with 10 mM MG before being spotted or spotted on YPD medium plates containing 15 mM GO. The plates were incubated at 30 °C and imaged at 36 hr. (B, C) Proteome glycation profile. Yeast strains were treated with 15 mM GO in the YPD culture medium and allowed to grow for 12 hr, followed by western analysis with anti-CML antibody. (D, E) MAGE detection by western blotting. Cells from the mid-log phase were incubated with 10 mM MG for 12 hr, and MAGE levels were estimated using an anti-MAGE antibody. Protein glycation levels were determined by measuring the whole lane intensities by densitometry and plotted with respect to WT. The blots stained with Ponceau S were used as the loading control. One-way ANOVA with Dunnet’s multiple comparisons test was used to determine significance from three independent biological replicates, *, p≤0.05; **, p≤0.01; ***, p≤0.001; NS, not significant.

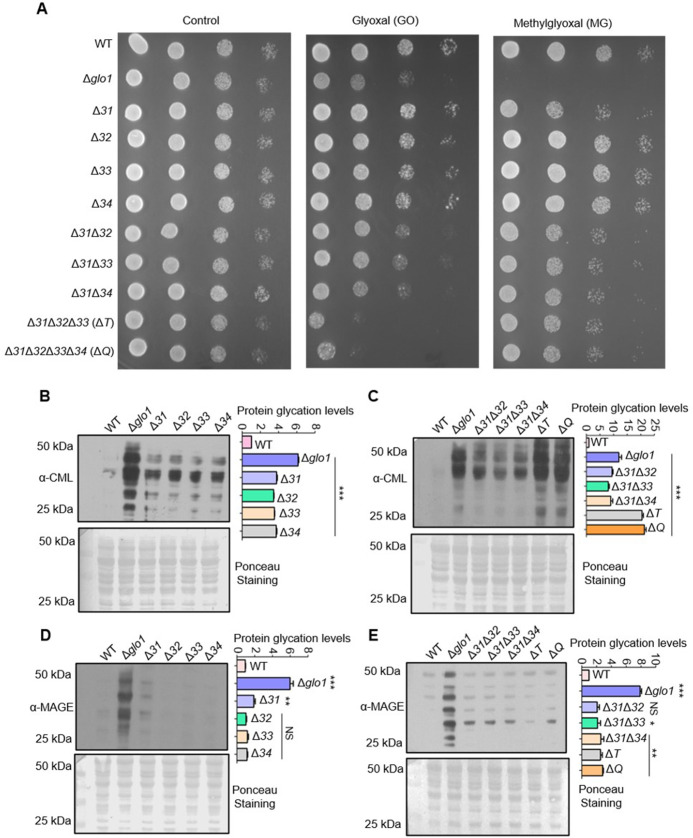
Figure 1—source data 1. Source data for Figure 1B contains raw image of western blot and densitometric values for graph.
Figure 1—source data 2. Source data for Figure 1C contains raw image of western blot and densitometric values for graph.
Figure 1—source data 3. Source data for Figure 1D contains raw image of western blot and densitometric values for graph.
Figure 1—source data 4. Source data for Figure 1E contains raw image of western blot and densitometric values for graph.

Figure 1.

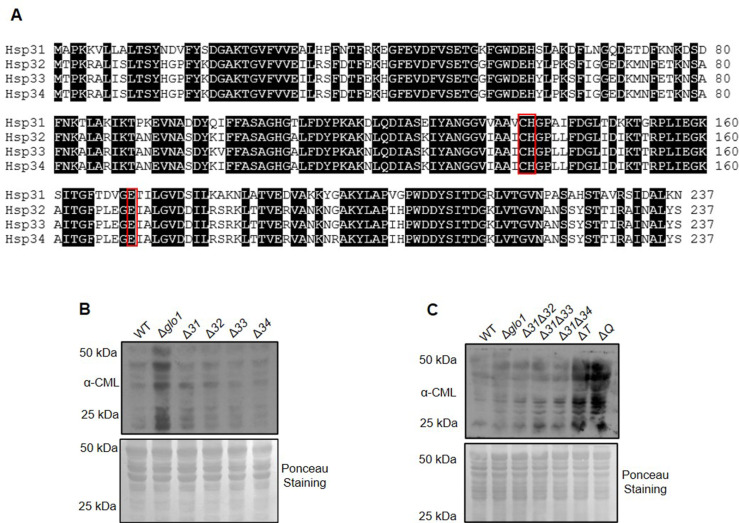
Figure 1—figure supplement 1. Amino acid sequence alignment of Hsp31 paralogs and protein glycation profile in the absence of GO stress.

Figure 1—figure supplement 1.

(A) Amino acid sequences of Hsp31 paralogs were aligned using the online tool Clustal Omega. Black shade indicates identical amino acids. Red boxes indicate amino acids of the catalytic triad. (B, C) Respective strains were grown till the stationary phase and subsequently lysed. The protein glycation levels were estimated by immunodetection using anti-CML antibody.
Figure 1—figure supplement 1—source data 1. Source data for Figure 1—figure supplement 1B contains raw image of western blot.
Figure 1—figure supplement 1—source data 2. Source data for Figure 1—figure supplement 1C contains raw image of western blot.