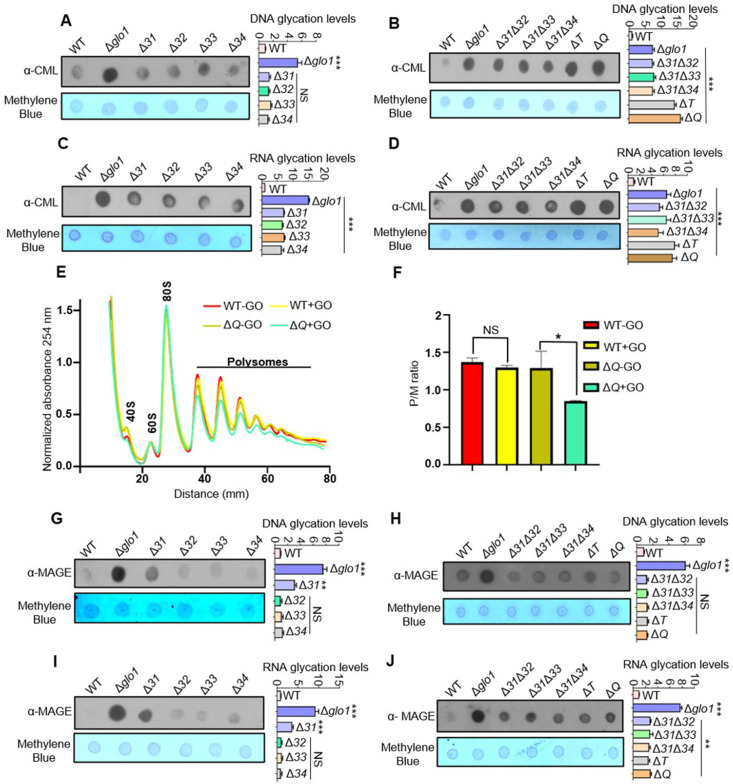
Figure 2. Loss of Hsp31 paralogs aggravates the glycation of DNA and RNA, affecting translational activity.
(A, B) Immunodetection of DNA using dot-blot assay. Three µg of total genomic DNA from respective strains treated overnight with 15 mM GO was dotted on nitrocellulose membrane and probed with anti-CML antibody. (C, D) RNA glycation profile. Global RNA extracted from cells incubated with 15 mM GO were dotted and analyzed using anti-CML antibody. (E) Polysome profiling. Untreated (-GO) and treated (+GO) WT and ΔQ cells with GO were subjected to polysome profiling. (F) Ratio of polysomes to monosomes (P/M). The area occupied by the polysome and the monosome peak was determined using Origin 8.0 for the respective samples, and the ratios were plotted. WT (+GO) was compared with WT (-GO), and ΔQ (-GO) was compared with ΔQ (+GO). (G–J) Estimation of MAGE-modified nucleic acids. Strains lacking Hsp31 paralogs were treated with 10 mM MG for 12 hr, and the genomic DNA and RNA were dotted on the membrane and probed with anti-MAGE antibody. The relative intensity of dots representing the glycation levels was calculated and compared to WT. One-way ANOVA with Dunnet’s multiple comparisons test was used to determine significance from three independent biological replicates, *, p≤0.05; **, p≤0.01; ***, p≤0.001; NS, not significant.


