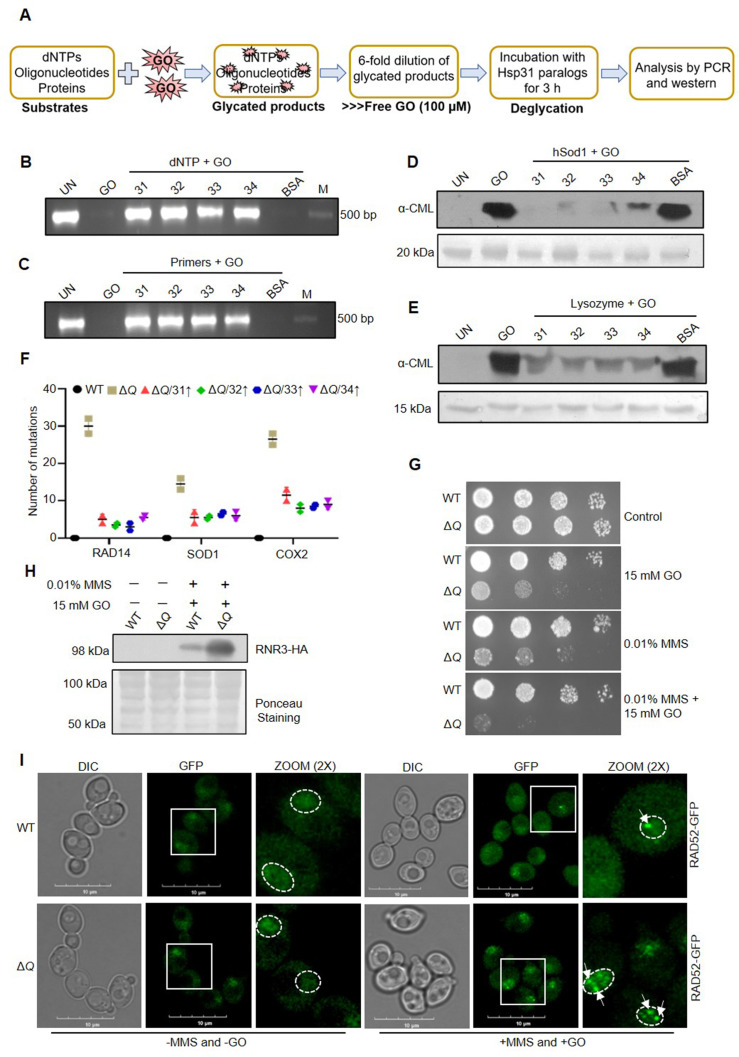
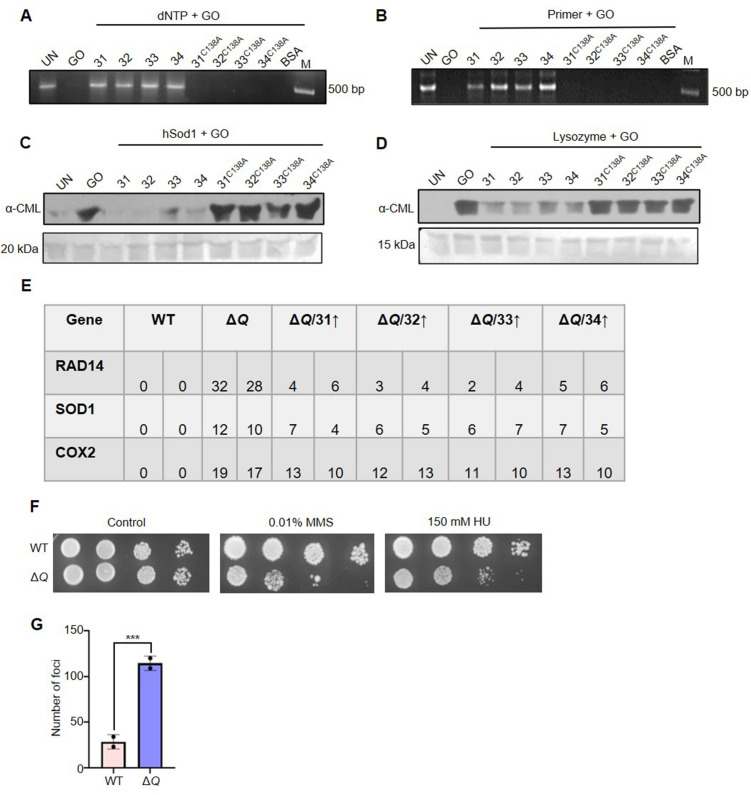
Figure 5. In vitro deglycation of DNA and proteins, and genotoxic sensitivity in the absence of yeast DJ-1 orthologs.
(A) Schematic representation of the experimental procedure followed for DNA and protein deglycation reactions. (B, C) Hsp31 paralogs deglycate DNA. 500 µM dNTPs (B) or 150 µM forward and reverse primers (C) were incubated without (UN) or with 2 mM GO for 2 hr, followed by 3 hr incubation with 5 µg Hsp31 paralogs. The samples were examined for deglycation through PCR. (D, E) Yeast DJ-1 members repair glycated proteins. 2 µg of purified protein hSod1 (D) or Lysozyme (E) were treated without (UN) or with 2 mM GO for 2 hr, and the reactions were further incubated for 3 hr with Hsp31 paralogs. Anti-CML antibody was used to determine glycation levels. BSA was used as a negative control in all experiments. 10 kb DNA ladder was used as a marker (M) for DNA gels, and the Ponceau S stain indicates the equal loading of protein samples. (F) Hsp31 paralogs attenuate genetic mutations. Individual genes were PCR amplified, and Sanger sequenced from the isolated genome of strains treated with 15 mM GO. The number of genetic mutations was calculated and plotted on GraphPad prism 5.0 (n=2). (G) Growth phenotypic analysis. Cells grown until the mid-log phase were spotted on plates containing 0.01% MMS or 15 mM GO or 0.01% MMS and 15 mM GO. The plates were incubated at 30 °C and imaged at 36 hr. (H) Western analysis of RNR3 levels. WT and ΔQ grown till the mid-log phase were supplemented with 0.01% MMS, and 15 mM GO in the culture media and further incubated for 3 hr. Subsequently, RNR3 levels were probed using an anti-HA antibody. (I) RAD52 foci formation. Cells were grown until the mid-exponential phase and were treated without (-) or with 0.03% MMS and 15 mM GO for 1 hr. Subsequently, cells were imaged using a confocal microscope (Olympus FV3000). Representative images have a 10 µm scale. All the experiments were performed in three independent biological replicates.


