. 2023 Aug 7;12:e88875. doi: 10.7554/eLife.88875

Figure 7. Dicarbonyl-induced translocation of yeast DJ-1 orthologs into mitochondria.

(A–E) Mitochondrial translocation of Hsp31 paralogs. WT strain expressing genomic GFP tagged Hsp31 paralogs, and MTS-mCherry (decorates mitochondria) plasmid were treated with either buffer (-GO/-MG) or 15 mM GO (+GO) or 10 mM MG (+MG) for 3 hr. Consequently, images were captured in a confocal microscope (Olympus FV3000) and represented with 10 µm scale. (F–G) Mitochondrial protein and DNA glycation levels. WT and ΔQ overexpressing Hsp31 class of proteins were treated with 15 mM GO stress, followed by isolation of mitochondria and western analysis to determine glyoxal modifications using anti-CML antibody. The intensity of each lane and dot was quantitated densitometrically and plotted in the graph. One-way ANOVA with Dunnett’s multiple comparisons test was used to determine significance from three independent biological replicates, *, p≤0.05; **, p≤0.01; ***, p≤0.001; NS, not significant.

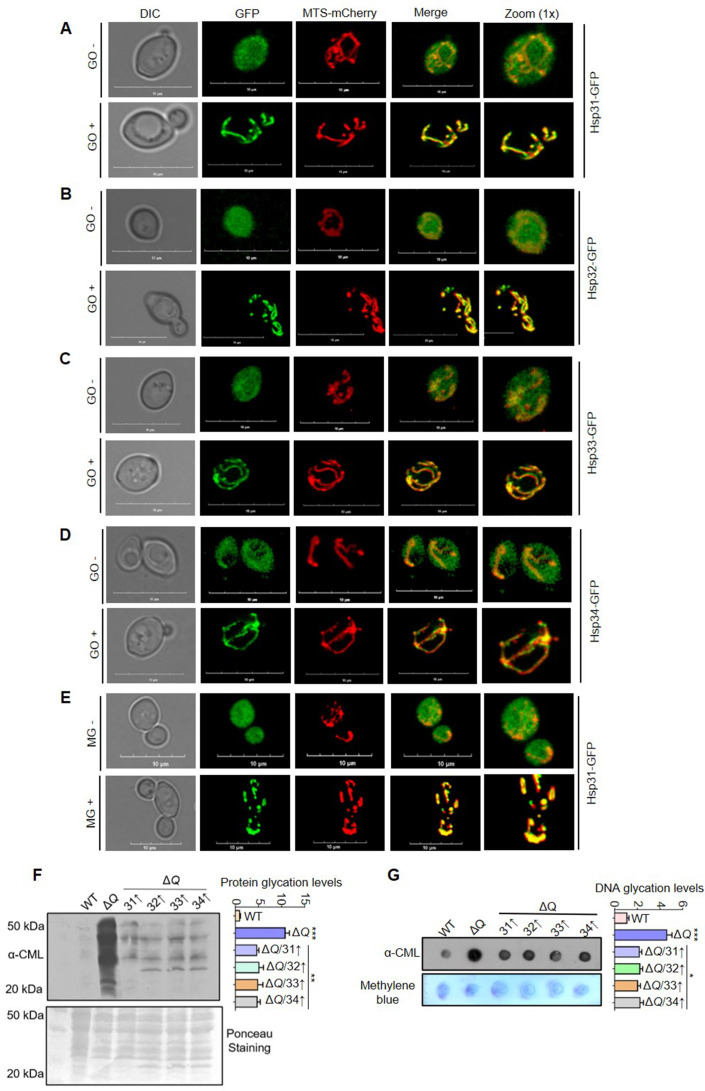
Figure 7—source data 1. Source data for Figure 7F contains raw image of western blot and densitometric values for graph.
Figure 7—source data 2. Source data for Figure 7G contains raw image of western blot and densitometric values for graph.

Figure 7.

Figure 7—figure supplement 1. Western and microscopic analysis of mitochondrial translocated Hsp31 paralogs.

Figure 7—figure supplement 1.

(A) Hsp31 paralogs genomically tagged with HA were treated with GO at log phase, and their levels were probed from fractionated mitochondria. For fold change, the band intensities were quantified and normalized with no treatment (-GO). The purity is indicated by the mitochondrial and cytosol control proteins, Tim23 and Ydj-1, respectively. (B) Probing mitochondrial translocated Hsp31. Mitochondria were isolated from MG-treated cells expressing Hsp31-HA. and subjected to immunoblotting to determine the levels. The band intensities from respective lanes were quantified and normalized with –MG. (C–E) MG does not affect the localization of Hsp32, Hsp33, and Hsp34. Cells containing genomic GFP-tagged Hsp31 paralogs and MTS-mCherry were incubated without (-MG) or with MG (+MG) and visualized under the microscope. (F) Purity of isolated mitochondria used in the study (Figure 7F, G) were analyzed for quality by probing with mitochondrial control, Tim23, and cytosol control Ydj-1 proteins. Paired t-test was used to determine significance of three independent biological replicates, *, p≤0.05; **, p≤0.01; ***, p≤0.001; NS, not significant.
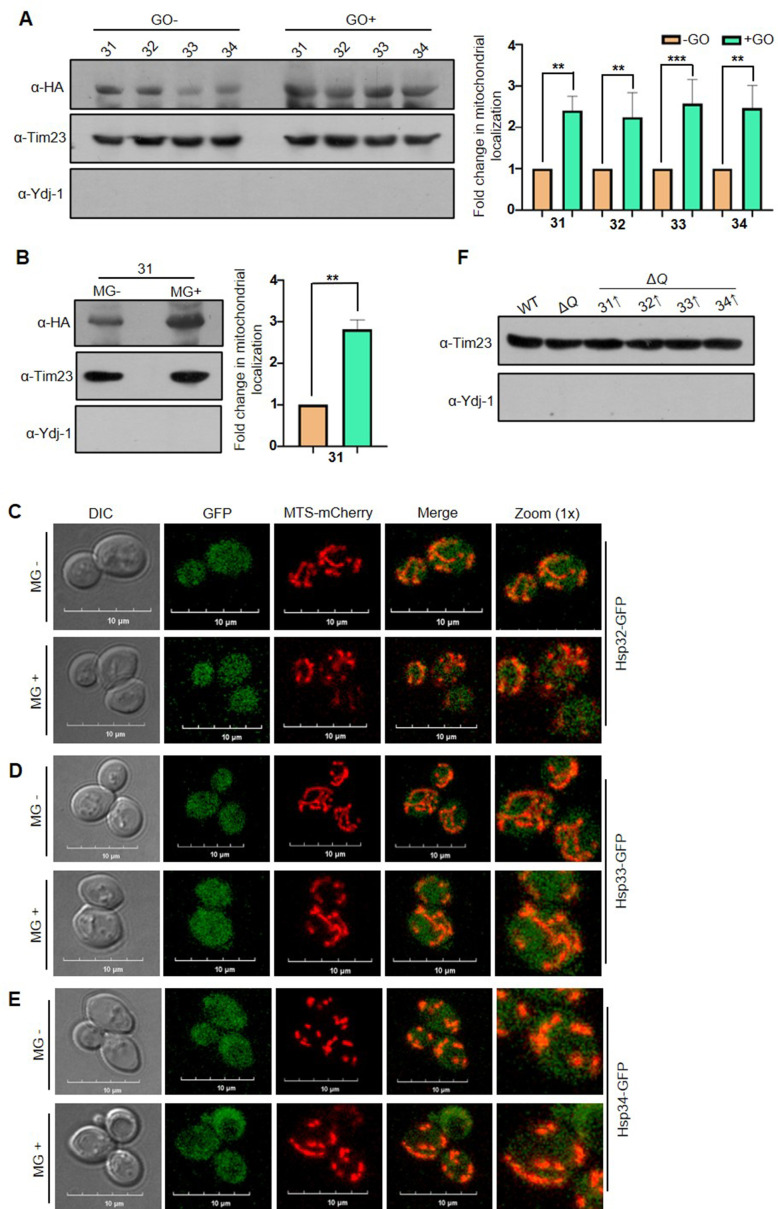
Figure 7—figure supplement 1—source data 1. Source data for Figure 7—figure supplement 1A contains raw image of western blot and densitometric values for graph.
Figure 7—figure supplement 1—source data 2. Source data for Figure 7—figure supplement 1B contains raw image of western blot and densitometric values for graph.
Figure 7—figure supplement 1—source data 3. Source data for Figure 7—figure supplement 1F contains raw image of western blot.