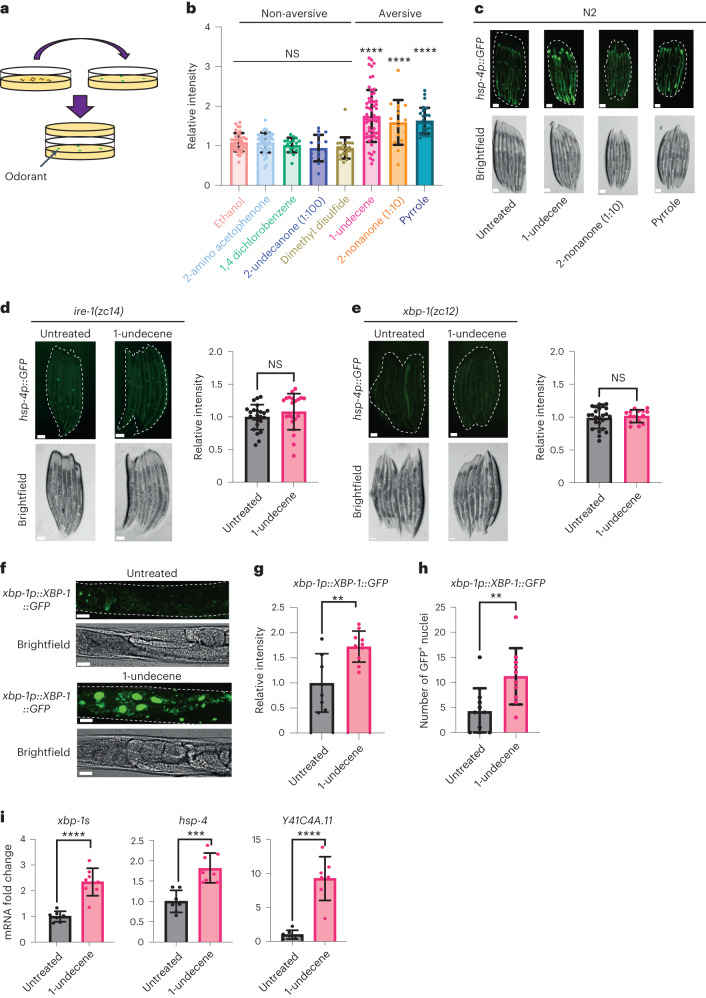
Fig. 1. Pathogen-associated odor activates the IRE-1/XBP-1 branch of the UPRER.
a, Schematic showing the experimental setup for the odorant exposure assay. In brief, young adult worms were sealed for 12 h in NGM plates together with another NGM plate containing four spots of 3 μl of odorant. b, Fluorescence intensity of hsp-4p::GFP after odorant exposure. Quantification of hsp-4p::GFP expression was performed in ImageJ, and data were normalized to untreated hsp-4p::GFP animals. This assay was independently performed three times (n = 39, 42, 17, 15, 21, 60, 16 and 27 animals). Graphs show mean ± s.d. ****P < 0.0001 (one-way ANOVA with Dunnett’s multiple comparison test). c, Representative fluorescence microscopy images of worms untreated or exposed to 1-undecene, 2-nonanone (diluted 10×) and pyrrole for 12 h. This assay was independently performed three times. Scale bars, 200 μm. d,e, Representative fluorescence microscopy images and quantification of hsp-4p::GFP fluorescence in ire-1(zc14) (d) and xbp-1(zc12) (e) worms with or without exposure to 1-undecene odor for 12 h. These experiments were repeated four times (n = 26 and 21 animals for d and n = 25 and 16 animals for e). Scale bars, 200 μm. Graphs show mean ± s.d. NS, not significant (two-tailed unpaired Student’s t-test). f, Representative image. g, Quantification of fluorescence. h, Number of GFP+ nuclei in the intestine of worms expressing an xbp-1p::xbp-1::GFP transgene with or without exposure to 1-undecene for 8 h. This experiment was repeated three times (n = 7 and 10 animals for g and n = 10 and 10 animals for h). Scale bars, 200 μm. Graphs show mean ± s.d. ****P < 0.0001 and **P < 0.01 (two-tailed unpaired Student’s t-test). i, mRNA levels of xbp-1s, hsp-4 and Y41C4A.11 were measured by qRT–PCR in animals exposed to 1-undecene for 8 h relative to untreated worms (n = 7 and 8 biological replicates). Graphs show mean ± s.d. ****P < 0.0001 and ***P < 0.001 (two-tailed unpaired Student’s t-test). Precise P values are provided in Source Data.

