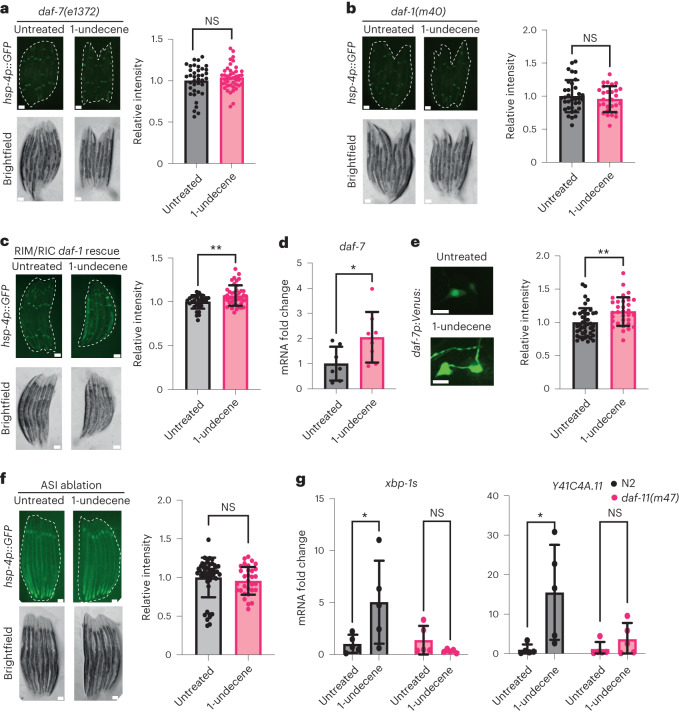
Fig. 3. DAF-7/TGF-β signaling is required for odor-induced UPRER activation.
a–c, Representative fluorescence microscopy images and quantification of hsp-4p::GFP fluorescence in daf-7(e1372) (a), daf-1(m40) (b) and daf-1(m40);ftEx205[tdc-1p::daf-1:gfp] (c) strains with or without exposure to 1-undecene for 12 h. Each experiment was repeated four times (n = 38 and 42 animals in a, n = 34 and 28 animals in b and n = 34 and 42 animals in c). Scale bars, 200 μm. Graphs show mean ± s.d. NS, not significant (two-tailed unpaired Student’s t-test) or **P < 0.01 (two-tailed unpaired Student’s t-test with Welch’s correction). d, mRNA levels of daf-7 were measured by qRT–PCR in animals exposed to 1-undecene for 8 h relative to untreated worms (n = 7 and 8 biological replicates). Graph shows mean ± s.d. *P < 0.05 (two-way ANOVA with Tukey’s multiple comparisons test). e, Representative fluorescence microscopy images and quantification of daf-7p::Venus fluorescence in ASI neurons after worms were exposed or not exposed to 1-undecene odor for 12 h. This experiment was repeated three times (n = 42 and 32 animals). Scale bars, 7 μm. Graph shows mean ± s.d. **P < 0.01 (two-tailed unpaired Student’s t-test). f, Representative fluorescence microscopy images and quantification of hsp-4p::GFP fluorescence in an ASI-ablated strain (oyIs84[gpa-4p::TU#813 + gcy-27p::TU#814 + gcy-27p::GFP + unc-122p::DsRed]). This experiment was repeated three times (n = 48 and 33 animals). Graph shows mean ± s.d. NS, not significant (two-tailed unpaired Student’s t-test). Scale bars, 200 μm g, mRNA levels of xbp-1s and Y41C4A.11 were measured by qRT–PCR in animals exposed to 1-undecene for 8 h relative to untreated worms (n = 5 biological replicates). Graphs show mean ± s.d. NS, not significant and *P < 0.05 (two-way ANOVA with Tukey’s multiple comparison test). Precise P values are provided in Source Data.

