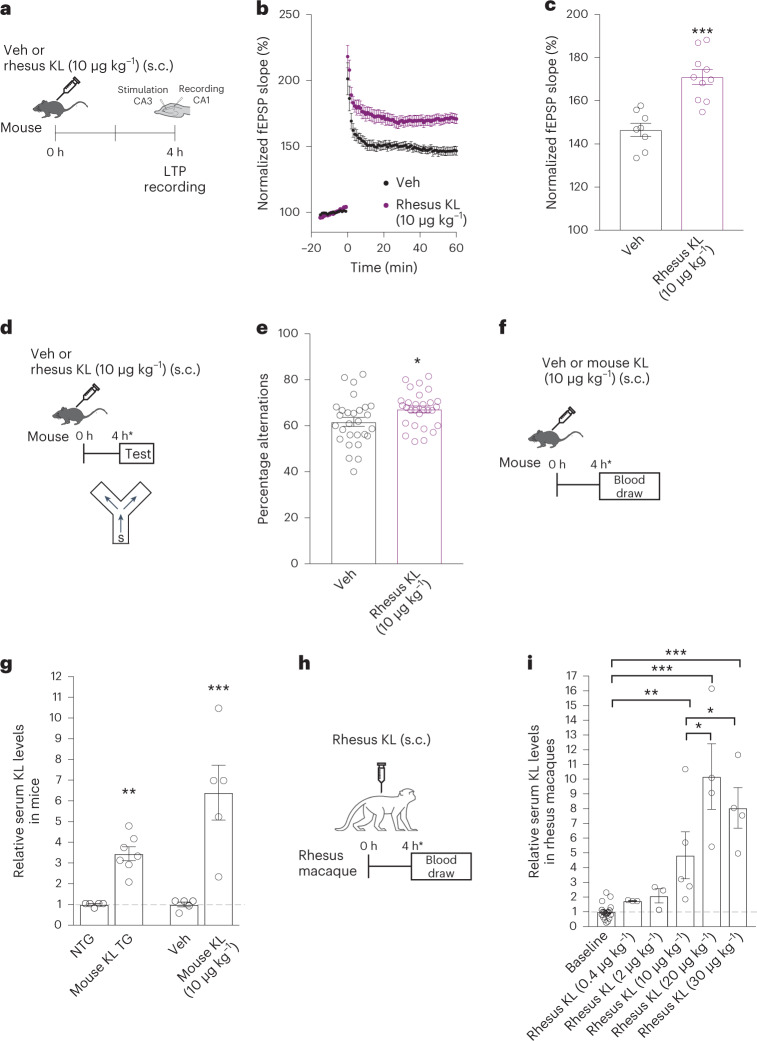
Fig. 1. Rhesus klotho is biologically active and increases serum KL levels in aged rhesus macaques.
a, Paradigm of hippocampal LTP recordings from young male mice treated with either vehicle (Veh) or rhesus KL (10 μg kg−1, s.c.). b, Field excitatory post-synaptic potential (fEPSP) recordings from acute hippocampal slices of mice (age 3 months) (n = 8 biologically independent slices from three mice for Veh; ten biologically independent slices from three mice for rhesus KL). c, Average fEPSP slope of the last 10 min of recordings from slices of mice (same as b). ***P < 0.0001 (two-tailed Student’s t-test); if biological unit is mouse, **P = 0.0039 (two-tailed Student’s t-test). d, Paradigm for testing male mice (age 4 months) in the small Y maze following treatment with Veh or rhesus KL (10 μg kg−1, s.c.). e, Percent alternations of mice (n = 28 mice, Veh; n = 29 mice, KL). Two independent cohorts combined. *P = 0.0243 (two-tailed Student’s t-test; *P = 0.0249 KL effect, accounting for cohort by linear regression two-tailed t-test). f, Paradigm for measuring serum KL levels in young male mice (age 4 months) 4 h following treatment with Veh or mouse KL (10 μg kg−1, s.c.). g, Relative KL serum levels from nontransgenic (NTG) and KL transgenic overexpressing (KL TG) mice alongside serum from young mice (age 4 months) 4 h following treatment with Veh or mouse KL (10 μg kg−1, s.c.) (n = 5 mice in each group of NTG, Veh, KL; n = 7 mice, KL TG). **P < 0.0001 versus NTG (two-tailed t-test), ***P = 0.0036 versus Veh (two-tailed t-test). h, Paradigm for measuring serum KL levels in aged rhesus macaques 4 h following treatment with Veh or varying doses of rhesus KL. i, Relative KL serum levels of aged rhesus macaques at baseline and following varying doses of KL (baseline, n = 19 monkeys; n = 14 female, n = 5 male; KL dosing, n = 3 monkeys in each group at 0.4 and 2 μg kg−1; n = 4 monkeys in each group at 20 and 30 μg kg−1; n = 5 monkeys at 10 μg kg−1; all female except one male at 10 μg kg−1). Values relative to baseline. *P = 0.0479 (KL 20 μg kg−1) and *P = 0.0508 (KL 30 μg kg−1) (one-tailed, one-sample t-tests versus KL 10 μg kg−1); **P = 0.0046 and ***P < 0.0001 versus baseline (two-tailed, Bonferroni-corrected). Data are represented as mean ± s.e.m.

