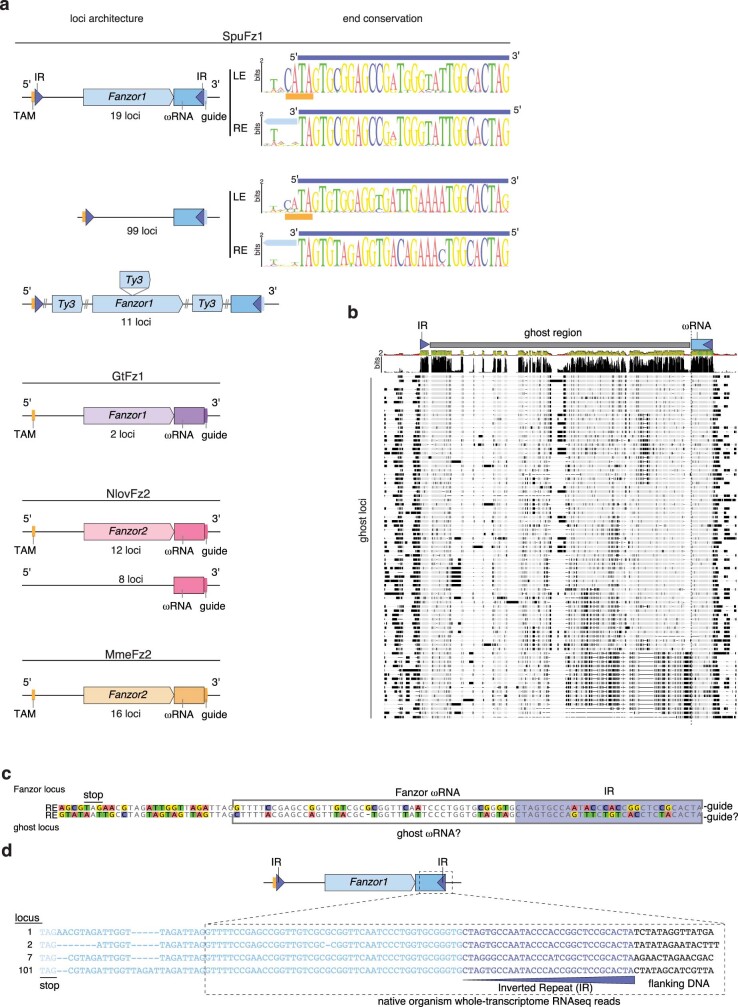
Extended Data Fig. 3. Fanzor and standalone ghost loci architecture.
a, Top: Comparison of loci architecture for Fz gene and ghost in S. punctatus and comparison of their Weblogo inverted repeat sequences (IR). IRs are shown as blue triangles, TAM regions as orange rectangles, Fz gene as a light blue arrow, ωRNA regions as medium blue rectangles with a downstream light blue rectangle showing the guide (spacer region). Fanzor and ghost loci share similar but distinct IRs. Bottom: Comparison of loci architecture for Fz gene and ghost in G. theta, N. lovaniensis, and M. mercenaria. b, Sequences alignments of ghost loci from IR to IR. Schematic of the architecture is shown on top of the alignment. Conservation is shown as bits on the top row. In the alignment, grey color indicates identity, black color indicates differences and lines indicate gaps. The sequences are sorted according to a phylogenetic tree made from the full nucleotide sequences in FastTree. IRs and ωRNA regions are strongly conserved across all ghost loci. c, Sequence alignment of the ωRNA region or IR of a Fanzor locus and a ghost locus. Nucleotide background colors highlight differences between ωRNAs. d, Small RNA-seq of Fanzor loci from S. punctatus shows expression of associated ωRNAs.

