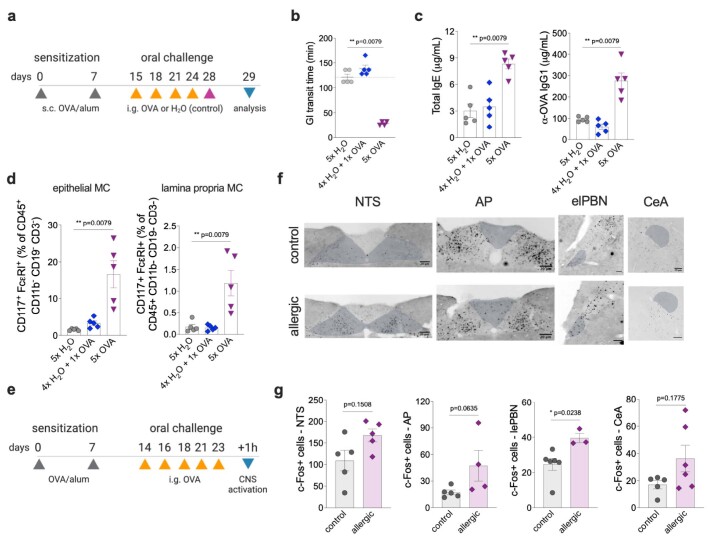
Extended Data Fig. 5. Enteric inflammation and brain activation upon acute or chronic allergen exposure.
a, Experimental protocol for the development of gut allergic inflammation. BALB/c WT mice were orally challenged with OVA five times (5x OVA group), once on d28 (4x H2O + 1x OVA group) or they received only i.g. water (5x H2O group). Prior to OVA challenges, all mice were s.c. sensitized with OVA and alum. b, Gastrointestinal transit time was determined on day 28 upon the fifth oral gavage (n = 4-5 per group). c, Total serum IgE (left) and OVA-specific IgG1 (right) antibodies (n = 5 per group). d, Flow cytometry analysis of small intestinal mast cells from the epithelial layer (left) and lamina propria (right) (n = 5 per group). e, Experimental protocol for brain activation analysis in allergic and control WT BALB/c mice. f, Immunofluorescence images of the nucleus tractus solitarius (NTS), area postrema (AP), central amygdala (CeA), and lateral external parabrachial nucleus (elPBN) from control (n = 5-6) or OVA/alum sensitized allergic (n = 3-6) mice using anti-cFos antibody, 90 min after the last OVA challenge. Scale bars = 20 µm. g, Number of cFos+ neurons in the NTS, AP, elPBN, and CeA of control or OVA/alum sensitized mice. Graphs show mean ± s.e.m. *p ≤ 0.05, **p ≤ 0.01. Two-tailed Mann-Whitney test. Each panel is representative of at least two independent experiments. a,e, Created with BioRender.com.

