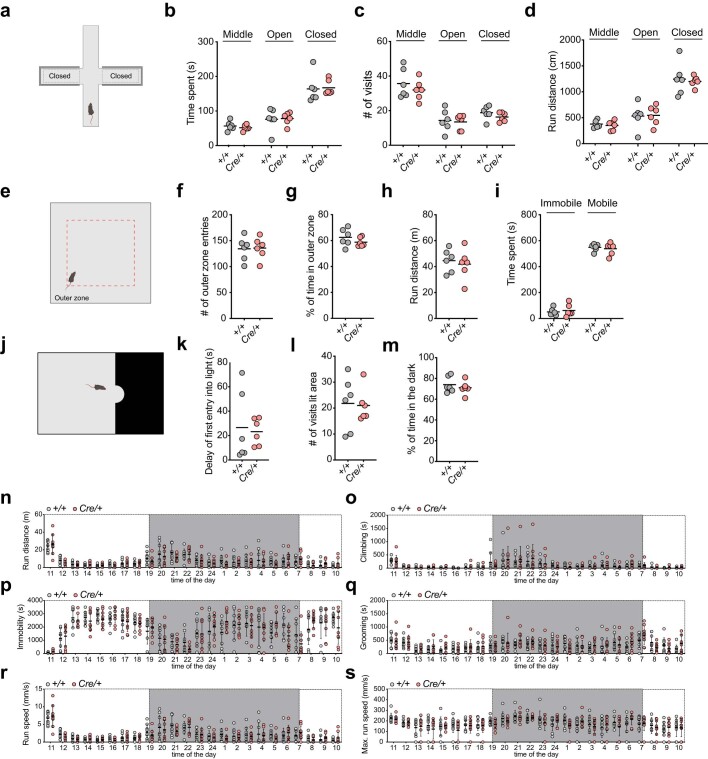
Extended Data Fig. 1. Anxiety and general behavioral tests of mast cell-deficient Cpa3Cre/+ mice.
C57BL/6 Cpa3+/+ and Cpa3Cre/+ mice were analyzed for behavioral deficits by elevated plus maze (a–d), open field (e–i), light dark chamber (j–m), and home cage monitoring (n–s). a. Model of the elevated plus maze. 300 s of behavior were digitally recorded, and automatically tracked using Sygnis tracker software. b, Time spent in middle, open, or closed arms of the plus maze. c, Number of visits into each arm. d, Run distance of mice within each arm. e, Model of the open field arena. 600 s of behavior were digitally recorded, and automatically tracked using ANY-maze video-tracking system. f, Number of outer zone entries. g, Time spent in outer zone as percentage of total observation time. h, Total run distance. i, Time spent immobile or mobile. j, Model of the light-dark box. 600 s of behavior were digitally recorded, and automatically tracked using Sygnis tracker software. k, Time delay for mice for first entrance into the dark area. l, Number of visits into the lit area. m, Time spent in outer zone as percentage of total observation time. The bars represent the mean values, and each dot is a single mouse (n = 6 mice in b–m). n–s, Laboras home cage monitoring results are depicted in (n) run distance, (o) climbing duration, (p) duration of resting, (q) grooming duration, (r) run speed, and (s) maximal run speed in one-hour bins over 24-hour observation periods. Day and night phases are shaded white and grey, respectively. The bars represent the mean values (± SD), and each dot is a single mouse (n = 9 mice for n–s).

