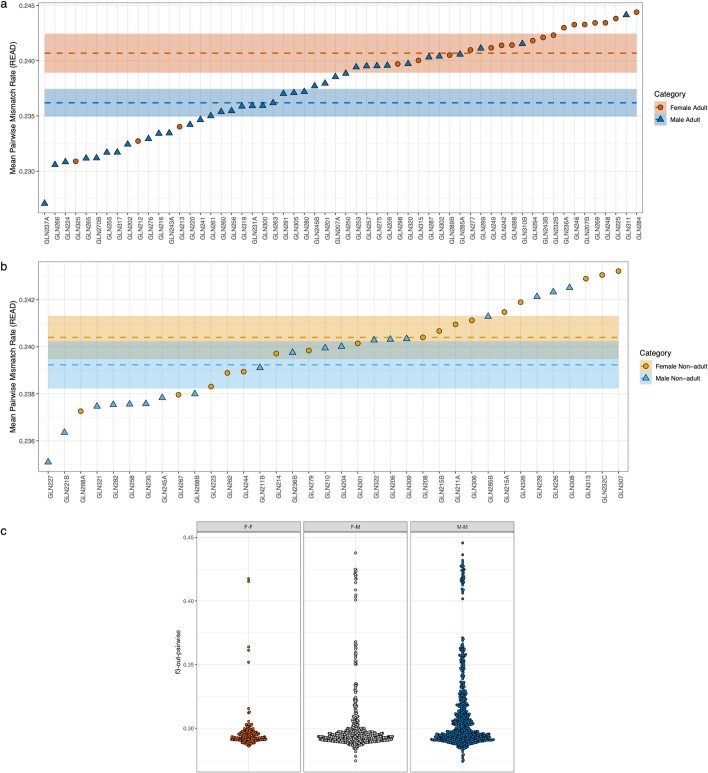
Extended Data Fig. 7. Trends of relatedness between female-male cohorts at Gurgy.
a, Average of the pairwise P0 values, obtained via READ, for all adult individuals. The lower the P0 value, the more related the individual is to the group, on average. Dashed lines show the average P0 values for each sex and 95% CIs are given as coloured bands. A two-sided Wilcoxon test shows that male individuals are significantly (P = 1.375e-05) more related to the group than female individuals (Supplementary Note 2, Supplementary Table 8). b, Average P0 for all subadult male and female individuals are not significantly differentially related to the group (two-sided Wilcoxon, p = 0.1067) (Supplementary Note 2, Supplementary Table 8). c, f3-outgroup statistics of the form f3(female, female; Mbuti), f3(female, male; Mbuti), and f3(male, male; Mbuti) for all adults. The deeper relatedness among pairs, whenever they involve at least one male individual, is, on average, higher than among female individuals (first- and second-degree related pairs are excluded from the calculation; Supplementary Table 12).

