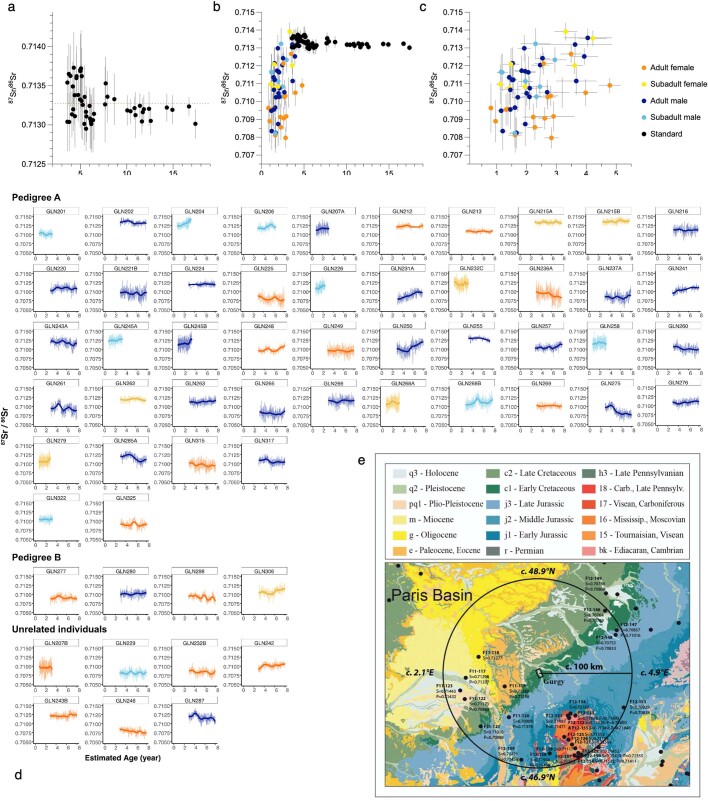
Extended Data Fig. 8. Results of radiogenic Sr isotope analyses.
a, Distribution of the standards (n = 52) average 88Sr and 87Sr/86Sr values and SD used to bracket the individuals 87Sr/86Sr values. The accepted 87Sr/86Sr value of 0.71310 for SRM-1400 is indicated by the dashed red line (Supplementary Table 22). b, Distribution of the standards (n = 52) and samples (n = 57) average 88Sr and 87Sr/86Sr values and SD (Supplementary Table 22). c, Distribution of the samples (n = 57) average 88Sr and 87Sr/86Sr values and SD (Supplementary Table 22). d, 87Sr/86Sr profiles of all individuals analysed in this study (n = 57). Each curve is plotted as a function of the reconstructed dental age, according to the sampled tooth (M1 or M2; https://doi.org/10.5281/zenodo.7224898). e, Geological map of the area surrounding Gurgy, as reconstructed by BRGM (https://infoterre.brgm.fr), with environmental 87Sr/86Sr ratios from the IRHUM database (Willmes et al. 2013). ‘P’ stands for ‘plants’ and ‘S’ for ‘soil’.

