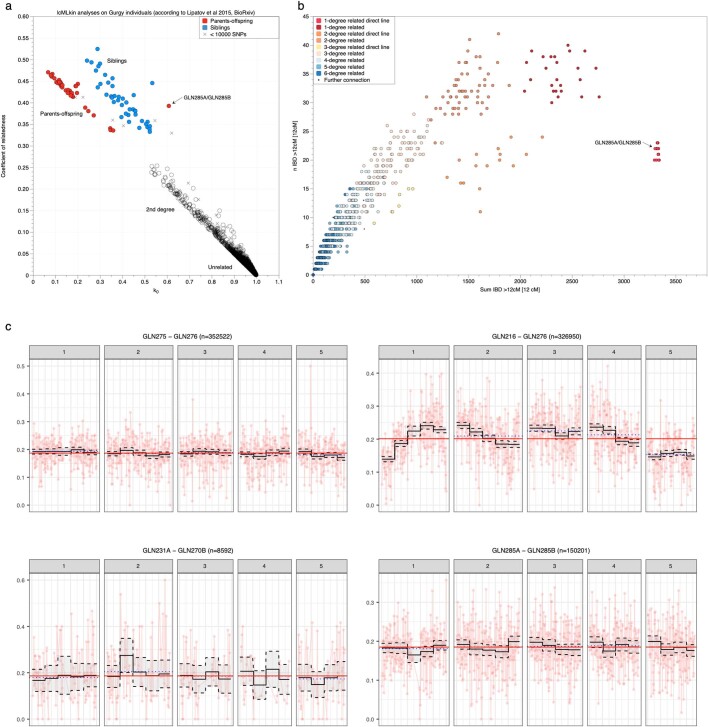
Extended Data Fig. 1. Biological relatedness analysis of the Gurgy individuals.
a, lcMLkin estimates of k0 and the coefficient of relatedness r. Clusters of different first-degree related individuals emerge when plotting these measures of relatedness against each other. Colours are given a posteriori according to the reconstructed trees. One inconsistency can be observed with the red point (parent-offspring relationship) plotting in the sibling cluster in blue, representing the pair GLN285A and GLN285B (Supplementary Note 2 and 3, Supplementary Table 9). b, Identity-by-descent (IBD) sharing analysis. Pairs of individuals plotted according to shared long blocks of IBD (>12cM), clustering by degrees of relatedness. Direct and indirect lineages form two different clines, indicating different numbers of meiosis events. From the fourth degree of relatedness, these clusters overlap (Supplementary Note 3, Supplementary Table 10). The pair GLN285A and GLN285B falls in the parent-offspring cluster. c, PMR-window plots. Pairwise-mismatch Rates (PMR) plotted along the chromosomes 1 to 5 in windows of 1 Megabase width. The number of overlapping SNPs is given in brackets. For example, the windowed estimate of PMR (dark line) is stable around the average PMR (red line) for the parent-offspring relationship GLN275-GLN276, whereas it is more variable for the full sibling relationship GLN216-GLN276. The pairs GLN231A-GLN270B and GLN285A-GLN285B are discussed in Supplementary Note 2.

