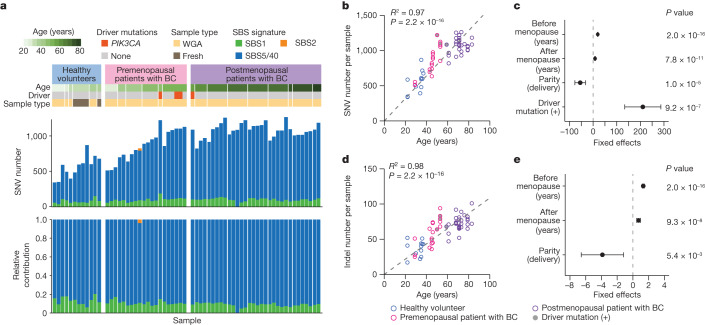
Fig. 1. Mutations in normal mammary epithelium.
a, Summary of SNVs found in 64 single-cell-derived organoids established from six healthy premenopausal breastfeeding women (healthy volunteers) and six premenopausal and nine postmenopausal patients with breast cancer (BC). Information about participant’s age, driver mutations and the presence or absence of WGA, are shown in the top panel. The stacked bar plots in the middle and bottom panels show the number of mutations and the proportion of indicated mutational signatures, respectively. b,d, The number of SNVs (b) and indels (d) in organoids (n = 64) are plotted for participant’s age. Regression lines assuming a zero intercept are applied to mean number of mutations for each participant (n = 21) and age, with R2 and P values from the two-sided F-test (grey dashed lines). c,e, Linear regression models were applied to 61 organoids with information on age at menopause and parity. Estimates of coefficients that significantly affect the number of mutations in the linear regression model are shown for SNVs (c) and indels (e), with 95% CI and P values from the two-sided t-test.

