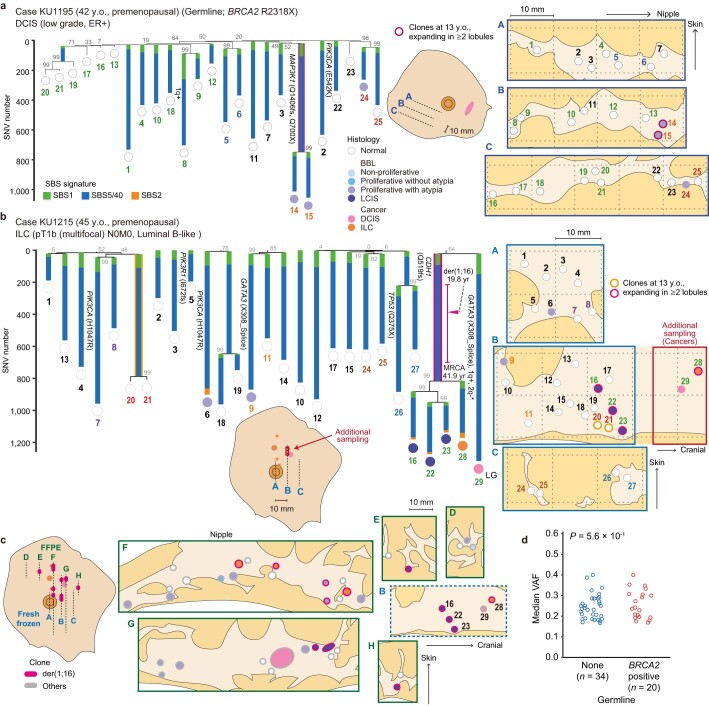
Extended Data Fig. 9. Clonal expansion in lobules without der(1;16).
a,b, Phylogenetic trees and the corresponding geographical maps of clones detected in multi-sampled lobules of two premenopausal breast cancer patients with a pathogenic BRCA2 variant (KU1195 (a)) and without pathogenic germline variants (KU1215 (b)). All the representations follow those in Fig. 4a. In the case of KU1215 (b), three der(1;16)(+) LCIS lesions (#16, #22, and #23) were detected unexpectedly; thus, additional sampling was performed in red-coloured tissue to investigate the correlation between der(1;16)(+) LCIS and cancers. LG, low grade DCIS. c, Geographical maps of clones detected with FISH using FFPE specimens in the case shown in b (KU1215). Coloured bars in the overview image and colours around the circles in split faces depict the clones to which samples belong. Circles numbered with black characters are samples analysed via WGS, whereas unnumbered circles show the lesions analysed only via FISH. d, Median VAF in histologically normal lobules carrying no somatic driver alterations in breast cancer patients with and without pathogenic germline variants, with P-values from the two-sided Mann–Whitney U test.

