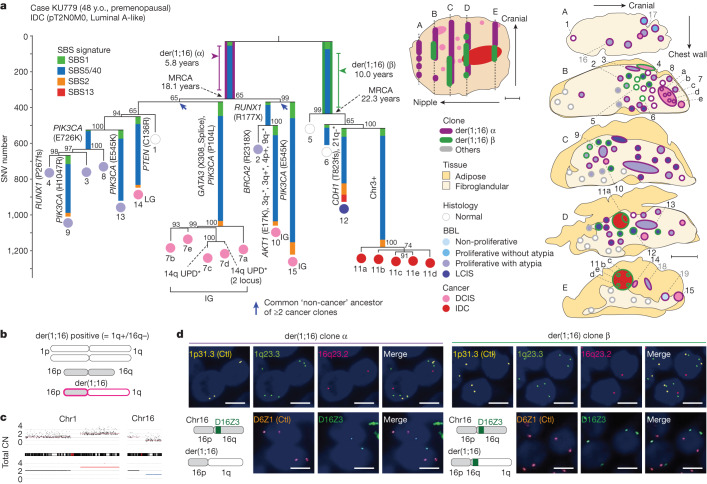
Fig. 2. Clonal evolution of breast cancers.
a, Phylogenetic tree (left) and corresponding geographical maps of clones detected in the surgical specimens of a patient with breast cancer who underwent lumpectomy (KU779) (middle, an overview of the surgical specimen; right, split faces of the sliced specimens indicated by dotted lines in the overview image). Signature extraction was performed on branches with more than 100 SNVs, and each branch is coloured according to the proportion of SBS signatures. Bootstrap values (%) are shown in grey. Driver mutations and CNAs (*focal changes) are shown on each branch. Estimated timing of der(1;16) acquisition and MRCA emergence are shown, with 95% CI for der(1;16) acquisition. Colours inside the circles indicate histological results. Numbers indicate samples in which each clone representing the tip of tree was identified. Grade of DCIS is shown in the tree (LG, low grade; IG, intermediate grade). Blue arrows indicate common ‘non-cancer’ ancestors of two or more cancer clones. Colours around the circles in split faces depict clones to which lesions belong. Each circle was analysed by WGS (black numbers) or targeted sequencing (grey numbers), and/or FISH (unnumbered). UPD, uniparental disomy. Scale bars, 10 mm; y.o., years old. b,c, Schema of der(1;16)(q10;p10), which leads to concurrent whole-arm 1q gain and 16q loss (b); copy-number plots on chromosomes 1 and 16 (no. 7d in KU779) are shown in c. d, Representative FISH images of der(1;16) clones α (out of 62 lesions) and β (out of 22 lesions) in KU779 (nos. 13 and 12, respectively). The probe set of 1p.31.3, 1q23.3 and 16q23.2 (top row) was designed to detect all types of der(1;16)(+) clone, wherein 1p.31.3 signals were used as controls (Ctl). The probe set of D6Z1 and D16Z3 (bottom row) was designed to distinguish between clones α and β in KU779, wherein D6Z1 signals were used as Ctl (schemas are shown at the bottom left). Scale bar, 5 μm.

