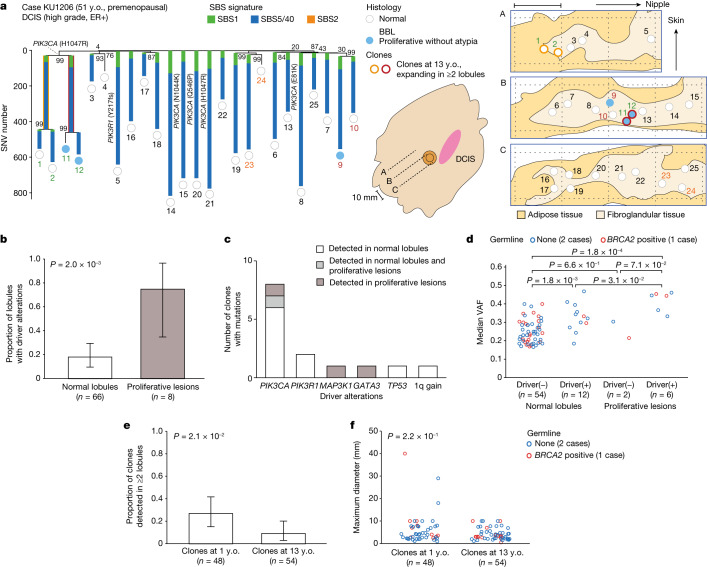
Fig. 4. Clonal expansion of non-cancer clones without der(1;16).
a, Phylogenetic tree (left) and corresponding geographical maps of clones detected in non-cancer lobules multi-sampled from the contralateral quadrant of the cancer-containing quadrant in a premenopausal patients with breast cancer without pathogenic germline variants (KU1206) (middle shows an overview of the surgical specimen, right shows split faces of the sliced specimens indicated by black dotted lines in the overview image). SBS signatures, bootstrap values, driver mutations, histological results and numbers are shown as in Fig. 2a. Numbers with the same colour depict samples belonging to the same clones that were present at the age of 1 year. As for clones that were present at the age of 13 years and detected in two or more lobules, corresponding shared branches in the trees and samples in the split faces are highlighted by colours and depicted with colours around circles, respectively. Scale bar, 10 mm. b, Proportion of lobules with driver alterations in histologically normal lobules (n = 66) and proliferative lesions (n = 8), with P values calculated using two-sided Fisher’s exact test. c, Number of clones carrying each driver alteration detected in the normal lobules and/or proliferative lesions. d, Median VAF in histologically normal lobules and proliferative lesions with and without driver alterations, with P values from the two-sided Mann–Whitney U-test. e,f, Proportion of der(1;16)(–) non-cancer clones detected in two or more lobules (e), and the maximum diameter of the area where each clone was observed (f); the clones present at the age of 1 year and 13 years, with P values from two-sided Fisher’s exact test (e) and the two-sided Mann–Whitney U-test (f), respectively. Whiskers in b and e indicate the 95% CI from the binomial distribution. The colours of plots in d and f depict the status of the germline variants.

