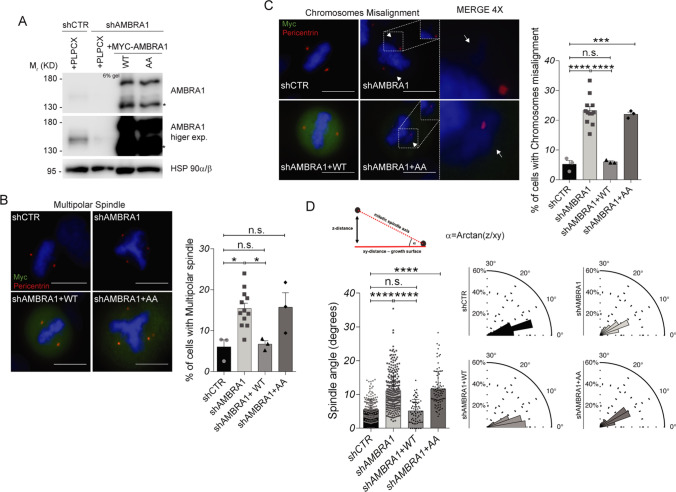
Fig. 4.
Lack of AMBRA1 phosphorylation causes mitotic defects. A WB of stably AMBRA1-silenced HeLa cells transfected with WT and phosphosilent (AA1209/1223) MYC-AMBRA1 or with the PLPCX empty vector. An asterisk marks a MYC-AMBRA1 degradation sub-product. Gel percentage is indicated in WB panel. B, C The same cells as in A were grown on coverslips and stained with anti-MYC antibody, to identify transfected cells, and anti-Pericentrin antibody, to identify centrosomes. Nuclei were stained with DAPI (scale bar = 8 μm). Merged images are shown, with 4X magnification shown only in C. White arrows indicate the misaligned chromosomes. The percentage of cells with each defect is represented in the graphs on the right. Bars show mean ± s.e.m. of the percentage of cells which exhibits the indicated defect, and significance is calculated with ordinary one-way ANOVA: * = p < 0.05; *** = p < 0.001; **** = p < 0.0001; n.s. = p > 0.05. Analysis was performed on 100–150 cells for each experiment. D The same cells as in A were grown on coverslips and stained with anti-MYC antibody, to identify transfected cells, and anti-Pericentrin antibody, to identify centrosomes and build the cell division axis. Nuclei were stained with DAPI. On the top left is shown a scheme of how mitotic spindle angle (α) is calculated. On the bottom left, mitotic spindle angle measure (degrees) is shown for all conditions. Bars show mean ± s.e.m. of 50–250 measures, and significance is **** (p < 0.0001) by ordinary one-way ANOVA On the bottom right mitotic spindle angle measure (degrees) is shown as a polar distribution

