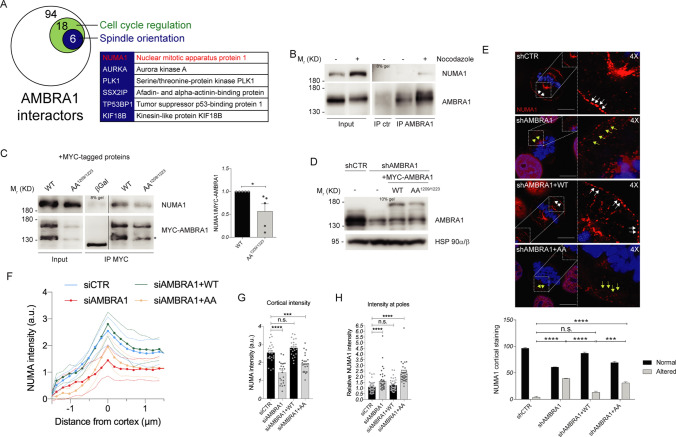
Fig. 5.
AMBRA1 phosphorylation regulates mitotic spindle function through NUMA1 mislocalization from cortex. A Diagram showing significant changing interaction for AMBRA1 upon Nocodazole treatment. HeLa cells, stably transfected with FLAG-AMBRA1, were grown in light (Lys0–Arg0) and heavy (Lys6–Arg10) SILAC medium. FLAG-AMBRA1 was immunoprecipitated and then eluates were analyzed by mass spectrometry. Here cell cycle regulators are indicated in the green circle while proteins involved in spindle orientation are indicated in the blue circle and specified in the flanking table. NUMA1 is highlighted in red. B, C WB of immunoprecipitated proteins following Nocodazole treatment: B Endogenous proteins were immunoprecipitated with AMBRA1 antibody. Mouse immunoglobulins were used as control (IP ctr). C Overexpressed MYC-AMBRA1 WT or AA1209/1223 and MYC-β-Galactosidase as control immunoprecipitated using anti-MYC antibody. The image derives from the same experiment in which lanes in the middle were cropped. Quantification, only for mitotic protein extracts, as the mean ± s.e.m. of five independent experiments is shown on the right, and significance is * (p < 0.05) by Student’s T test. D WB of stably AMBRA1-silenced or transfected with WT and phosphosilent (AA1209/1223) MYC-AMBRA1 HeLa cells. E Analysis of NUMA1 staining for the same cells in D. Merged images of a single confocal plane and 4X magnification are shown for each condition (scale bar = 10 μm). White and yellow arrows indicate NUMA1 cortical staining. The number of cells with an altered NUMA1 staining at the cortex is shown in the graph on the bottom, and significance is n.s. (p > 0.05), *** (p < 0.001) or **** (p < 0.0001) by two-way ANOVA. F NUMA1 line profiles across the cortex from HeLa cells stably expressing GFP-NUMA1 transfected with indicated siRNAs and mCherry-PLPCX or mCherry-AMBRA1 WT or AA1209/1223. Solid line represents the mean intensity with s.d. represented by dotted lines. N(number of cells, number of independent experiments): siCTR + mCherry (24, 3); siAMBRA1 + mCherry (23, 3); siAMBRA1 + mCherry-AMBRA1 WT (23, 3); siAMBRA1 + mCherry-AMBRA1 AA1209/1223 (23, 3). G NUMA1 levels at the cortex extracted from (F). Individual cortical intensities with mean ± s.e.m. are plotted. P-values were calculated using Student’s T test and significance is: n.s. (p > 0.05), *** (p < 0.001), **** (p < 0.0001). H The same cells as in (F) were used for quantification of NUMA1 intensity at the poles of mitotic spindles at metaphase. Levels at individual poles are plotted along with mean ± s.e.m. N(number of cells, number of independent experiments): siCTR + mCherry (21, 3); siAMBRA1 + mCherry (23, 3); siAMBRA1 + mCherry-AMBRA1 WT (21, 3); siAMBRA1 + mCherry-AMBRA1 AA1209/1223 (20, 3). P-values were calculated using Mann–Whitney U test and significance is: n.s. (p > 0.05), **** (p < 0.0001). An asterisk marks a MYC-AMBRA1 degradation sub-product. Gel percentages are indicated in each WB panel

