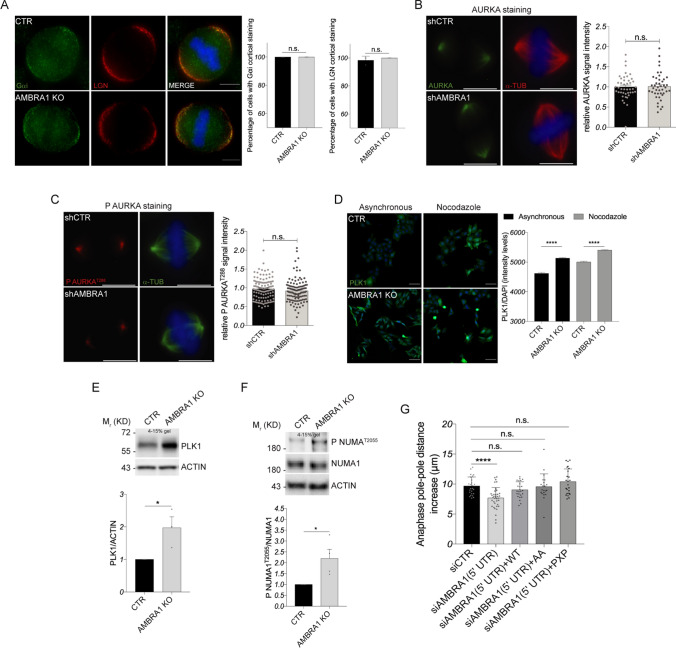
Fig. 6.
AMBRA1 depletion impairs PLK1 and CDK1 signaling on NUMA1. A Analysis of LGN and Gαi staining for CTR and AMBRA1 KO HeLa cells. Fluorescent microscopy images are shown on the left (scale bar = 8 μm), while on the right are shown the relative graphs as mean ± s.e.m. of three independent experiments. Significance is n.s. (p > 0.05) by Student’s T Test. B, C AURKA (B) and P AURKAT288 (C) staining of stable AMBRA1-silenced HeLa cells. The spindle is marked with α-TUBULIN antibody. Fluorescent microscopy images are shown on the left (scale bar = 8 μm), while on the right is shown the relative signal intensity as mean ± s.e.m. of about 40 measures for AURKA (B) and of about 120 measures for P AURKAT288 (C). Significance is n.s. (p > 0.05) by Student’s T Test. D High-content imaging analysis of PLK1 staining in CTR and AMBRA1 KO HeLa cells treated or not with Nocodazole. Nuclei were stained with DAPI (scale bar = 150 μm). PLK1 signal intensity is shown in the graph on the right. Bars show mean ± s.e.m. of 2000–10,000 measures, and significance is ****(p < 0.0001) by ordinary one-way ANOVA. E, F WB analysis of protein extracts from CTR and AMBRA1 KO HeLa cells treated with Nocodazole. Quantification, as mean ± s.e.m. three (E) and four (F) independent experiments, is shown at the bottom, and significance is * (p < 0.05) (E) by Student’s T test. G Quantification of pole-pole distance increase over metaphase spindle length during anaphase. Individual values with mean ± s.d. are plotted. N(number of cells, number of independent experiments): siCTR (25, 3); siAMBRA1 (5’ UTR) (37, 3); siAMBRA1 (5’ UTR) + WT (25, 3); siAMBRA1 (5’ UTR) + AA (21, 3); siAMBRA1 (5’ UTR) + PXP (24, 3). Significance is n.s. (p > 0.05) and **** (p < 0.0001) by Student’s T Test. Gel percentages are indicated in each WB panel

