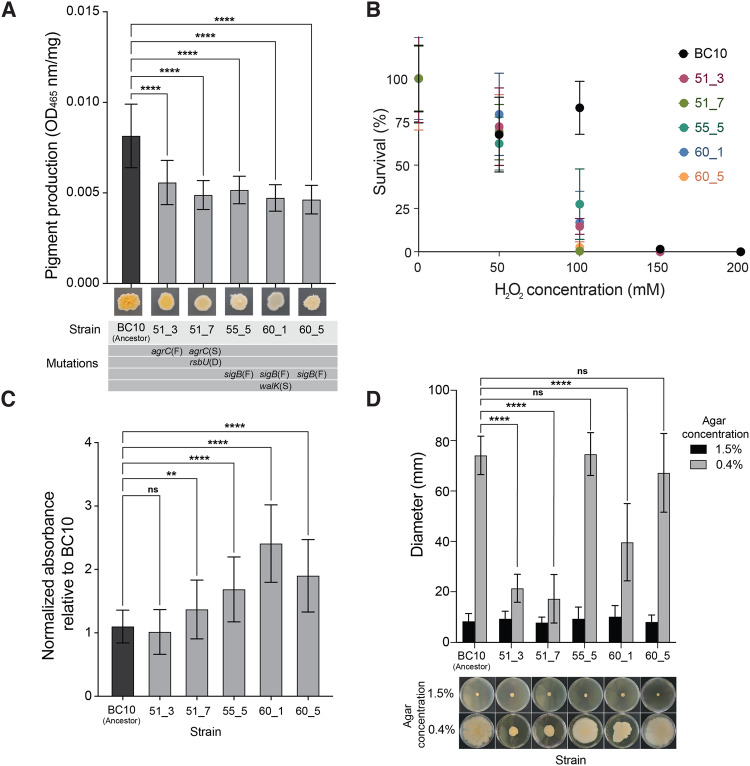
Fig. 3. Phenotypic assays reveal biological impacts of global regulator mutations in evolved S. xylosus BC10.
A Pigment production in the ancestor and evolved strains of S. xylosus BC10. Bars represent means and error bars represent standard deviations. **** indicates p < 0.0001 based on ANOVA with Dunnett’s test. Data are from three independent experiments with six replicates of each treatment within each experiment. B Survival of the ancestor and evolved strains of S. xylosus BC10 across a range of H2O2 concentrations. Dots represent means and error bars represent standard deviations. At 100 mM, the S. xylosus BC10 ancestor had a higher survival compared to all evolved strains (two-way ANOVA, p < 0.0001). Data are from two independent experiments with eight replicates of each treatment within each experiment. C Biofilm production of ancestor and evolved strains of S. xylosus BC10. Bars represent means and error bars represent standard deviations. ** indicates p < 0.01 and **** indicates p < 0.0001 based on ANOVA with Dunnett’s test. ns indicates not significant. Data are from three independent experiments with nine replicates of each treatment within each experiment. D Spreading of ancestor and evolved strains of S. xylosus BC10. Photos at the bottom of the graph show representative plates from the 1.5% (low spreading) and 0.4% (high spreading) conditions. Bars represent means and error bars represent standard deviations. **** indicates p < 0.0001 based on ANOVA with Dunnett’s test. ns indicates not significant. Data are from three independent experiments with five replicates of each treatment within each experiment.

