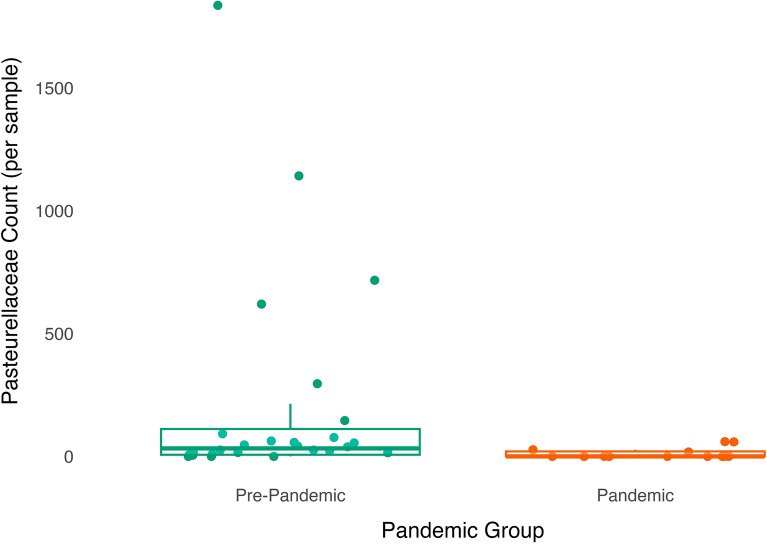
Figure 6.
Abundance of taxa from the Pasteurellacae family in the gut microbiome is lower among infants sampled during the pandemic than infants sampled pre-pandemic. Dots (green are pre-pandemic samples, orange are pandemic samples) have been jittered along the x-axis to increase visibility of individual data points. Boxplot represents the median (line in the middle of the box), upper 25% quantile (top of the box), lower 25% quantile (bottom of the box), upper 25% quantile minus 1.5 times the interquartile range (upper whisker), and lower 25% quantile minus 1.5 times the interquartile range (lower whisker) abundance values. N = 13 pandemic samples and 24 pre-pandemic samples as differential abundance analyses were performed on the subsample with complete data on all covariates.

