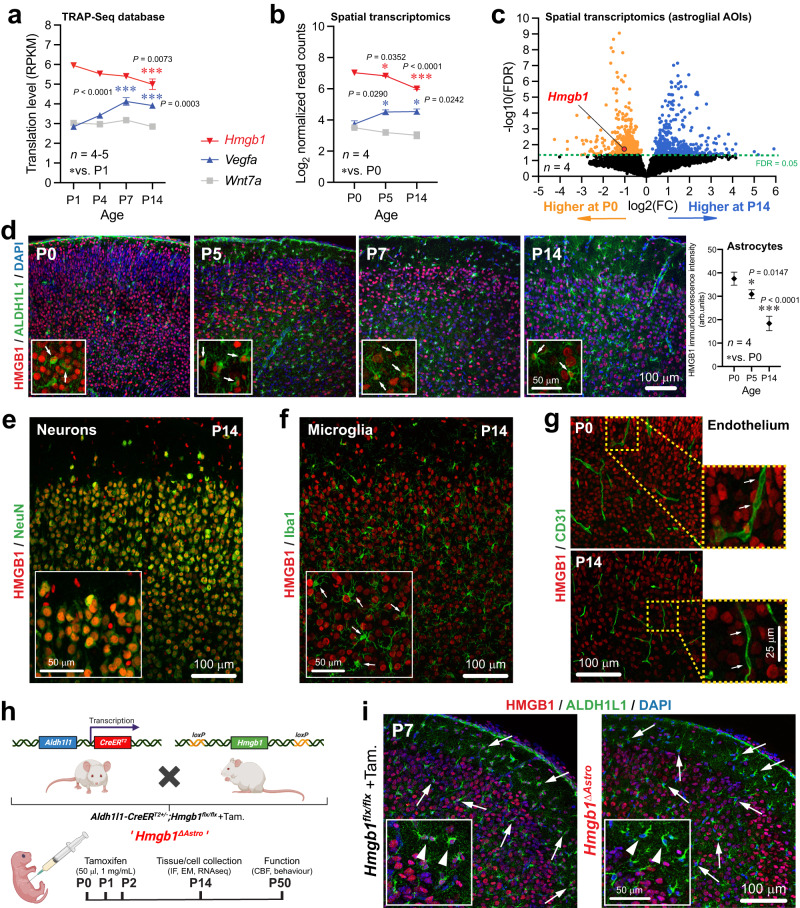
Fig. 2. HMGB1 is highly expressed in astrocytes around birth in the mouse cerebral cortex.
a Expression (reads per kilo base per million mapped reads, RPKM) of Hmgb1 relative to known pro-angiogenic astroglial genes at P1, P4, P7 and P14 from Star Database (https://stardb.cu-bic.ca/). Data are mean ± SEM. *p < 0.05, **p < 0.01, ***p < 0.001 (One-way ANOVA and Tukey’s post-hoc test). Comparisons were made with respect to P1. b In situ expression (normalized read counts) of Hmgb1 relative to known pro-angiogenic genes at P0, P5 and P14 in astrocyte-enriched (ALDH1L1+CD31−) areas of interest (AOIs). Data are mean ± SEM. *p < 0.05, **p < 0.01, ***p < 0.001 (One-way ANOVA and Tukey’s post-hoc test). Comparisons were made with respect to P0. c Volcano plot (False discovery rate, FDR, versus Log2 fold change, FC) to visualize astroglial genes with differential expression between P0 and P14 in situ. d Left, Fluorescence micrographs of immunostained somatosensory cortex sections at specific time-points during postnatal development. Insets displayed higher magnifications. Arrows indicate HMGB1 immunoreactivity (red) in ALDH1L1+ astrocytes (green). Right, Quantification of astroglial HMGB1 immunoreactivity at P0, P5 and P14. Data are mean ± SEM. *p < 0.05, ***p < 0.001 (One-way ANOVA and Tukey’s post-hoc test). e Fluorescence micrograph showing HMGB1 (red) in NeuN+ neurons (green) at P14. Inset displayed higher magnification. f Fluorescence micrograph showing lack of HMGB1 (red) in Iba1+ microglia (green) from P14 mice. Inset displayed higher magnification, and arrows point at microglial cells. g Fluorescence micrographs of somatosensory cortical sections immunostained with CD31 (green) and HMGB1 (red) at P0 and P14. Insets displayed higher magnifications. h Diagram of mating strategy and tamoxifen injections for selective Hmgb1 ablation from astrocytes, with experimental end points. i Fluorescence micrographs showing immunostaining for ALDH1L1+ astrocytes (green) and HMGB1 (red) in control and Aldh1l1-CreERT2;Hmgb1flx/flx (or Hmgb1ΔAstro) mice. Insets displayed higher magnifications. Arrows and arrowheads point to astrocytes with (left) or without (right) HMGB1. All displayed microscopy images are representative of experiments repeated in at least 4 mice per group, with similar results. Source data are provided as a Source Data file.

