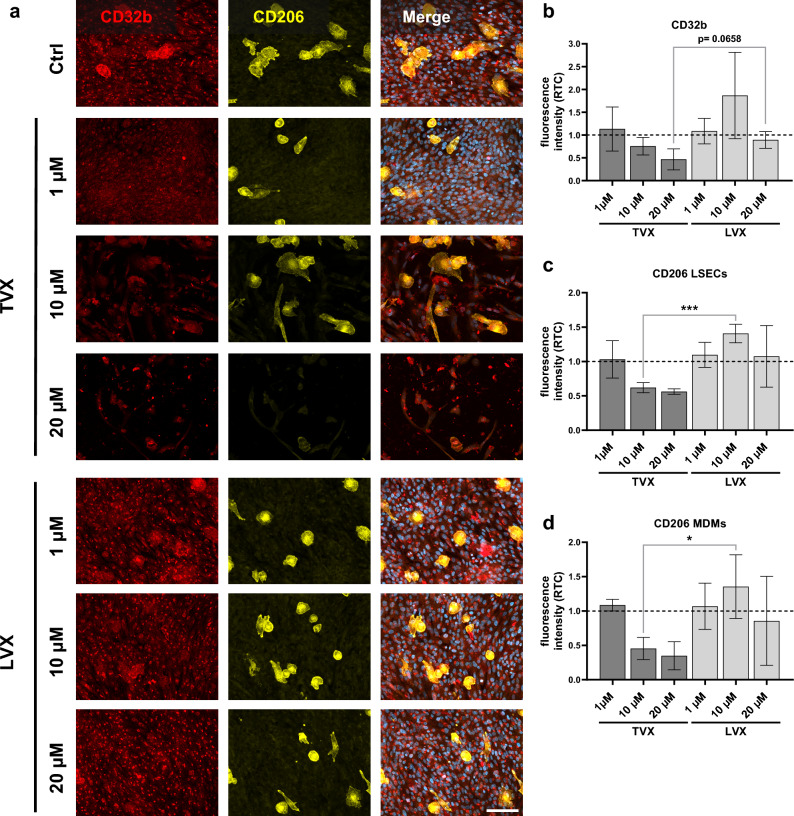
Figure 2.
Morphological analysis of vascular cell layers in the liver model. (a) Representative immunofluorescence images of vascular layers (LSECs/ MDMs) stained for CD32b (red), CD206 (yellow) and nuclei (DAPI, blue in merge image) after treatment with control (Ctrl, 0.1% DMSO), TVX and LVX at a concentration of 1 µM, 10 µM or 20 µM for 7 days. Scale bar, 100 µm. (b–d) Signal quantification of CD32b (b), CD206 LSECs (c) and CD206 MDMs (d) fluorescence intensities. Bars show fluorescence intensity plotted as ratio to control (RTC, dotted baseline) and represent mean ± SD of 3 independent experiments (n = 3 with 5 randomly selected membrane regions for each condition). *p ≤ 0.05, ***p ≤ 0.001 (One-way ANOVA with Dunnett’s multiple comparison test, two-tailed t test for comparison between indicated conditions).

