Figure 3.
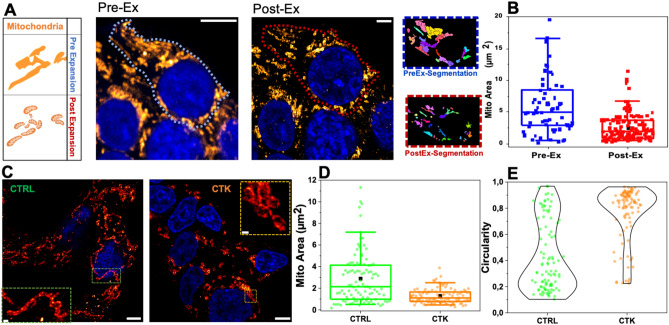
ExM for mitochondria investigation. (A) Mitochondrial network confocal images and algorithm segmentation in unexpanded and expanded INS1E cells stained for TOM20. (B) Box plot shows morphometric analysis performed by using the MorphoLibJ plugin. The mitochondrial area is expressed as µm2. Data are presented as box plots with whiskers at the 5th and 95th percentiles, the central line at the 50th percentile, and the ends of the box at the 25th and 75th percentiles (n. of mitochondria = 100 for control and treated samples; 2 independent experiments). A Mann–Whitney test was performed (***P < 0.001, ****P < 0.0001). Cells were acquired by confocal microscope using 405 and 488 excitation light, with 63x/NA1.4 objective lens. Scale bar 10 µm. (C) Representative images of expanded INS-1E cells stained for TOM20 after incubation with fresh medium (CTRL) and cytokines (CTK) for 24 h. Scale bar 10 µm. The structural analysis on expanded mitochondria shows a reduced area (D) and high circulatory value (tending to 1) (E) in cytokine-treated samples.

