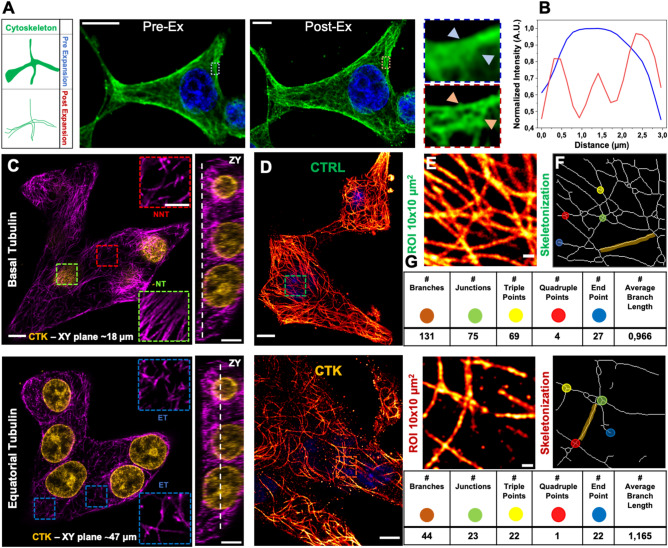
Figure 5.
Proinflammatory cytokines promote microtubule rearrangement in INS-1E cells. (A) Pre- and post-expansion confocal images of INS-1E stained for α-tubulin, with magnified views of boxed regions and (B) profiles of intensity taken along the blue and red arrows. (C) Representative Z-stack image of treated sample and ROI collection at different planes. ROI were taken at the basal plane (Z-plane ~ 18 µm)—in the proximity of the nucleus (termed Nuclear Tubulin; NT) and outside the nucleus (termed No Nuclear Tubulin, NNT)—and at the equatorial level (Equatorial Tubulin, ET; Z-plane ~ 47 µm). The ZY projection shows an example of the localization along the Z-axis. Scale bar 10 µm. (D) Representative images and microtubule-network analysis of expanded INS-1E cells untreated (control, CTRL) and treated with cytokines (CTK). Cells were stained for α-tubulin and DAPI and acquired by confocal microscope using 405 and 488 excitation light, respectively, with 63x/NA1.4 objective lens. (E) ROI of 10 × 10 µm2 were then analyzed by FiNTA and skeletonized through Fiji (F), to quantify the reduction in the number of branches (# Branches), junctions (# Junctions), triple and quadruple points (# Triple and Quadruple points), endpoints (# Endpoints), and average bench length (G). Scale bar 10 µm.

