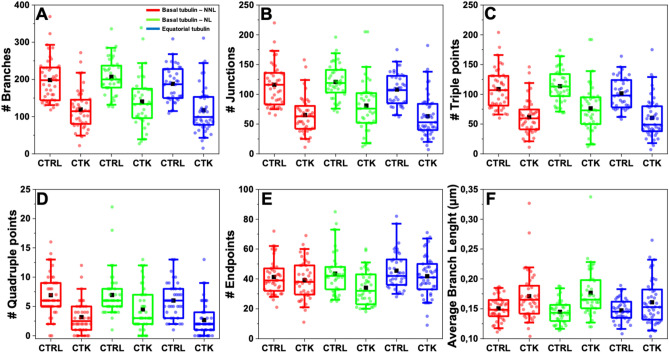
Figure 6.
Quantification of microtubule rearrangement in INS-1E cells after cytokine treatment in different areas of the cell. Quantification of MT density per ROI: # Branches (A), # Junctions (B), # Triple (C) and Quadruple (D) points, # Endpoints (E), and Average Branch Length (F). Cytokine-treated specimens were significantly different from the control condition in each plane. In addition, the average branch length increases in cytokine treated samples with respect to the control. Data were presented as box plots with whiskers at the 5th and 95th percentiles, the central line at the 50th percentile, and the ends of the box at the 25th and 75th percentiles (n ≥ 39; 3 independent experiment). A Mann–Whitney test was performed.

