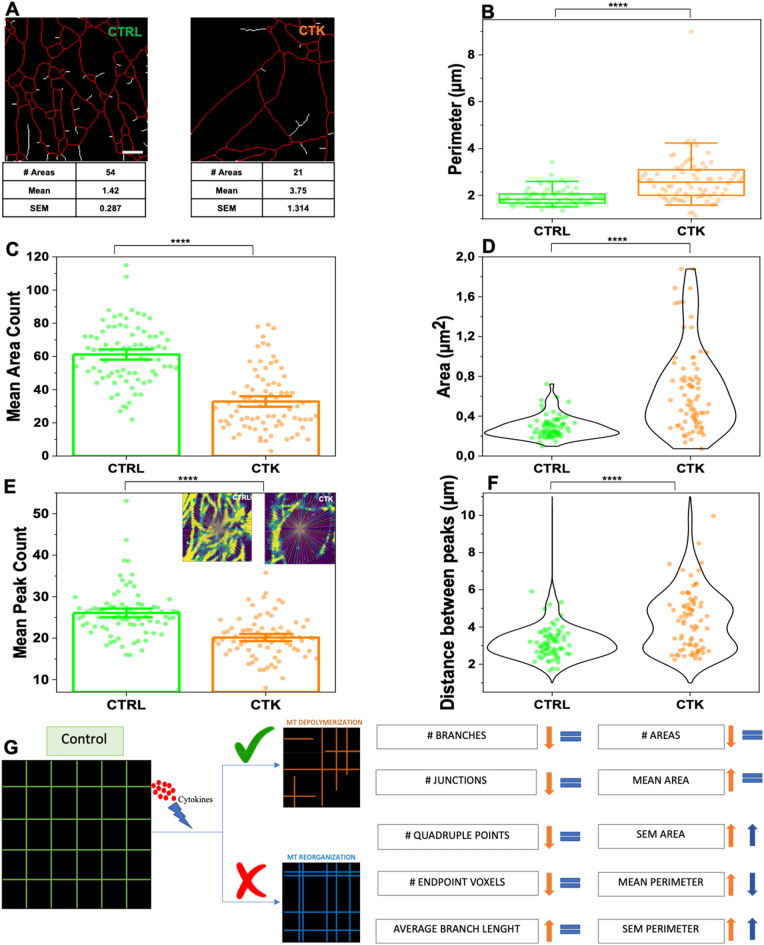
Figure 7.
Proinflammatory cytokines promote microtubule rearrangement in INS-1E cells. (A) MT opening analysis by using MorphoLibJ algorithm. The number of opening and mean areas were calculated for each ROI in control and treated samples. (B) Treatment with cytokine induces significant increase in corollas size, including mean perimeter. Data were presented as box plots with whiskers at the 5th and 95th percentiles, the central line at the 50th percentile, and the ends of the box at the 25th and 75th percentiles (n = 78; 3 independent experiments). Bar ± SEM (C) and Violin plot (D) show the number of MT openings and mean area, respectively, for each ROI. (n = 76; 3 independent experiments). Bar ± SEM (E) and violin plot (F) show the mean peak count and mean distance between peaks per ROI based on a intensity distribution analysis of 175 lines passing from the frame center in control and cytokine-treated samples (boxes in E). A Mann–Whitney test was performed. Scale bar 10 µm. (G) Schematic model of tubulin alterations after cytokine treatment. Data on the left were calculated manually, data on the right were calculated with MorphoLibJ. These results demonstrate that the orange model is more affine to the ExM data.

