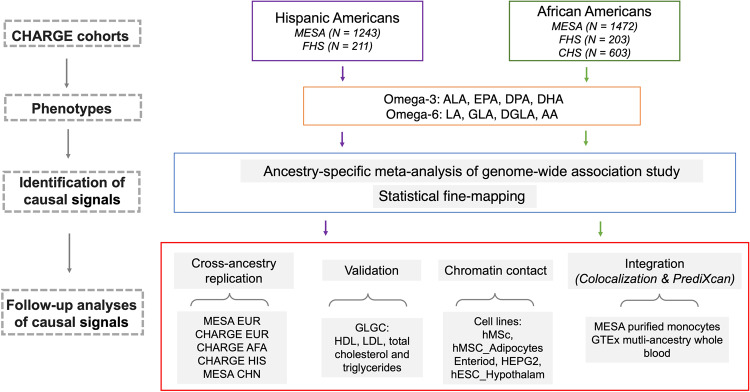
Fig. 2. Study design.
Figure 2 shows the study design. GWAS of PUFAs was applied for each cohort stratified by HIS and AFA. Ancestry-specific GWAS meta-analysis and statistical fine-mapping were applied separately for HIS and AFA to identify the potential causal signals. Multiple follow-up analyses were conducted for the causal signals, including cross-ancestry replication, validation, chromatin contact analysis and integrative analyses.

