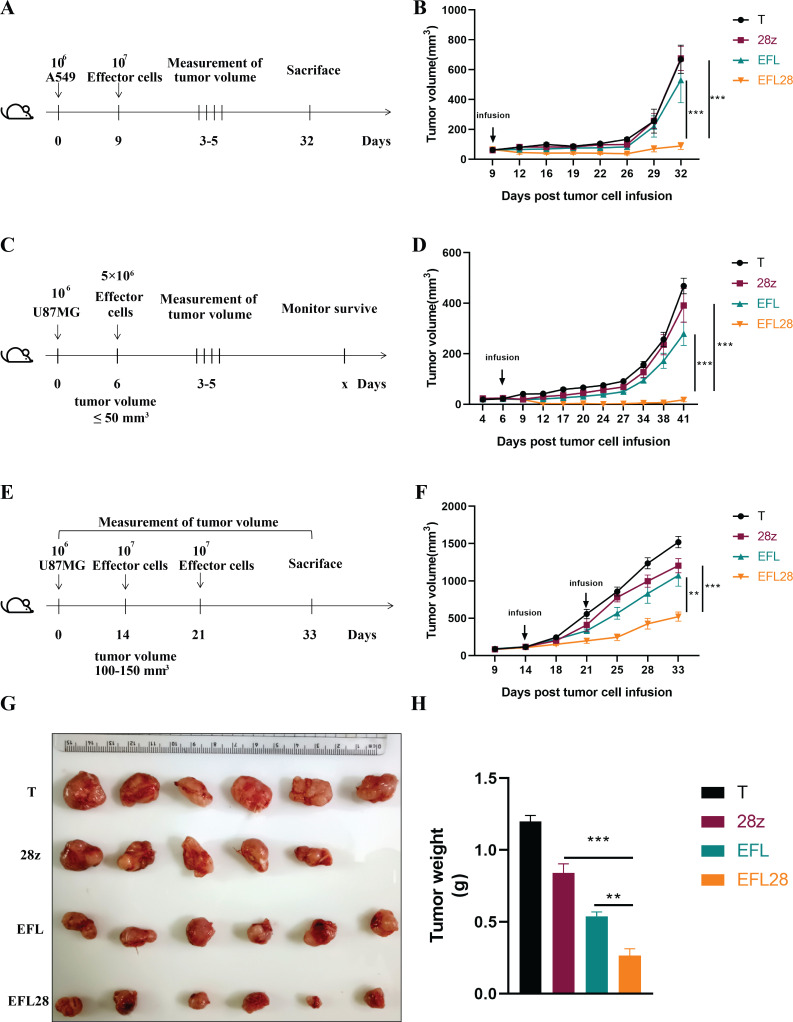
Figure 3.
Anti-EDB rTCR-CAR T cells demonstrated the most tumor growth inhibition in NCG mice. (A) Schematics for the A549 tumor in vivo testing. (B) Ten million effector cells were intravenously administered, n=5. (C) Schematics for the U87MG tumor (tumor volumes <50 mm3) in vivo testing. (D) Ten million effector cells were intravenously administered, n=5. (E, F) NCG mice were subcutaneously inoculated with 106 U87MG cells on day 0. Two doses of 107 EDB-targeted CAR T cells or T cells were intravenously administered on days 14 and 21. Tumor growth is presented as the mean tumor volume and SEM. (G, H) On day 33 after tumor cell inoculation, the mice were euthanized. Tumor weight was measured, and statistical significance for the difference was analyzed by two-way analysis of variance with Bonferroni post hoc test. Survival was plotted using a Kaplan-Meier curve, and statistically significant differences were analyzed using the log-rank test, **p<0.01, ***p<0.001.

