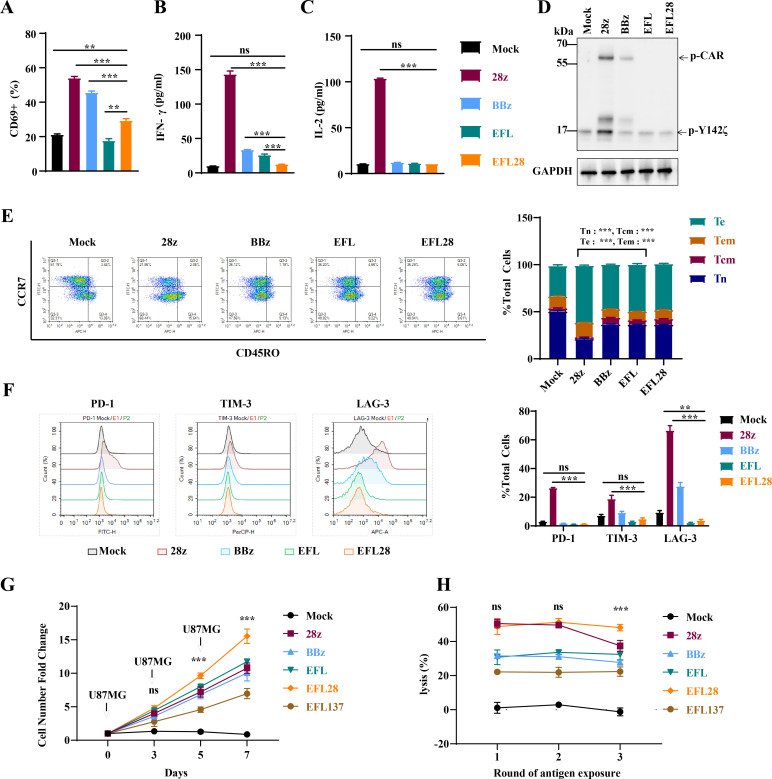
Figure 7.
Differences between second-generation CAR and chimeric rTCR-CAR T cells. (A–D) Primary human T cells were transduced with lentivirus to obtain effector cells expressing CARs, and T cells were transduced with the empty virus to obtain control cells. (A) Cells were cultured without antigen exposure for 14 days. The positive rate of CD69 in each group was detected by flow cytometry (n=3). (B C) Expression levels of IFN-γ and IL-2 were detected by ELISA, n=3. (D) Cell proteins were extracted from each group, and the phosphorylation level of CD3ζ was detected by Western blot. (E) The differentiation and (F) exhaustion of CAR T cells in each group without antigen stimulation were detected by flow cytometry, n=3. (G) Proliferation of CAR-T cells with repeated antigen stimulation, n=3. (H) Cytotoxicity of CAR-T cells after 1, 2, or 3 times of antigen exposure, n=3. Statistical significance was calculated by one-way analysis of variance with Bonferroni post hoc test, **p<0.01, ***p<0.001. CAR, chimeric antigen receptor.

