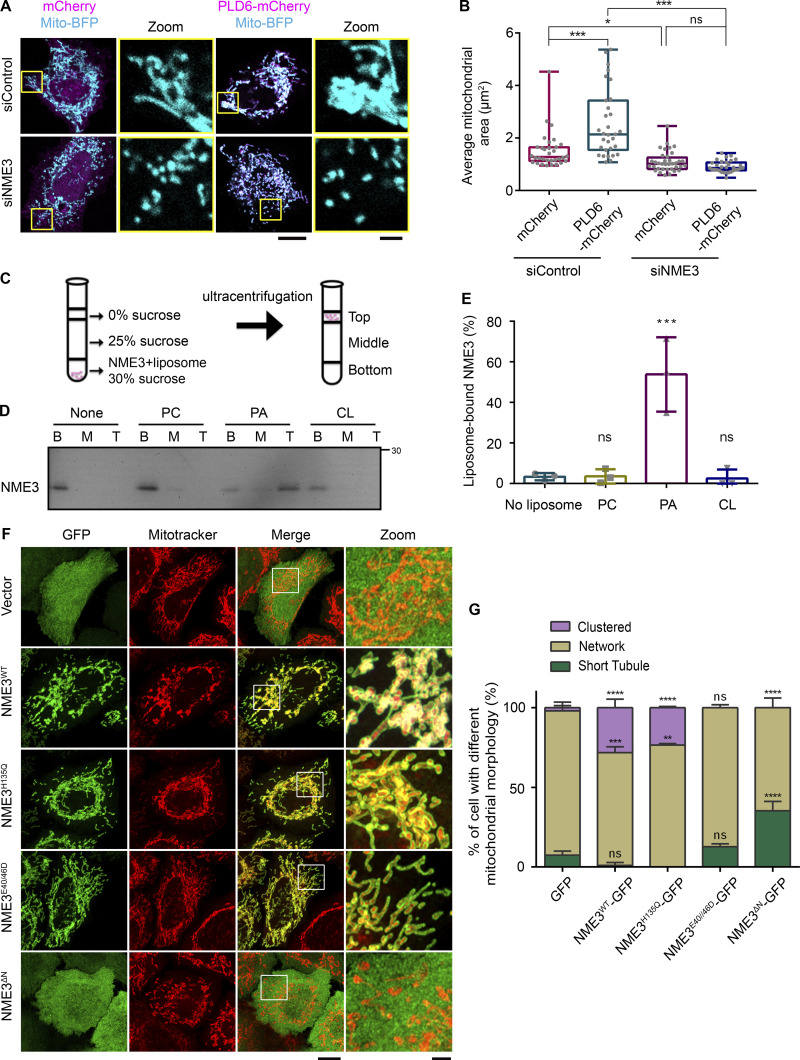
Figure 1.
NME3 binds to PA and is a downstream effector of PLD6. (A) NME3 is required for the mitochondrial clustering effect induced by PLD6-mCherry overexpression. Control or NME3-depleted HeLa cells were transfected to overexpress mCherry or PLD6-mCherry. (B) The mitochondria in these cells were labeled by mito-BFP, and the average area of individual mitochondria was measured by ImageJ and shown in B. Each dot represents the averaged mitochondrial area of one cell. Scale bar, 10 μm. Bar for inset image, 2 μm. (C) Liposome flotation assays. NME3-His was incubated with or without liposome for 30 min. After binding, the suspension was adjusted to 30% w/v sucrose and overlaid with two layers of sucrose buffer and subjected to ultracentrifugation. After centrifugation, the top, middle, and bottom fractions were collected and analyzed by Western blotting. (D) NME3WT binds to PA-containing liposomes. 1 μM NME3WT was incubated with 300 μM, 100 nm liposome with different lipid compositions: 99% DOPC, 20% DOPA:79% DOPC or 20% CL:79% DOPC. (E) The proportion of NME3WT in top fraction was quantified and compared in E. (F) Effects of exogenous NME3-GFP overexpression on mitochondrial morphology. HeLa cells transfected with indicated NME3-GFP constructs were labeled with a mitotracker and imaged with Airyscan confocal microscopy. Boxed areas were magnified and shown aside. Scale bar, 10 μm. Bar for inset image, 2 μm. (G) Morphology of mitochondria were divided into three categories: short tubule, network, or clustered, to compare the effects of NME3-GFP on mitochondria from F. Data are expressed as mean ± SD of at least three independent experiments. Three different sets of experiments with more than 90 cells of each condition were quantified and analyzed with one-way ANOVA. *P < 0.05; **P < 0.01; ***P < 0.001; ns, not significant. Source data are available for this figure: SourceData F1.

