Figure 3.
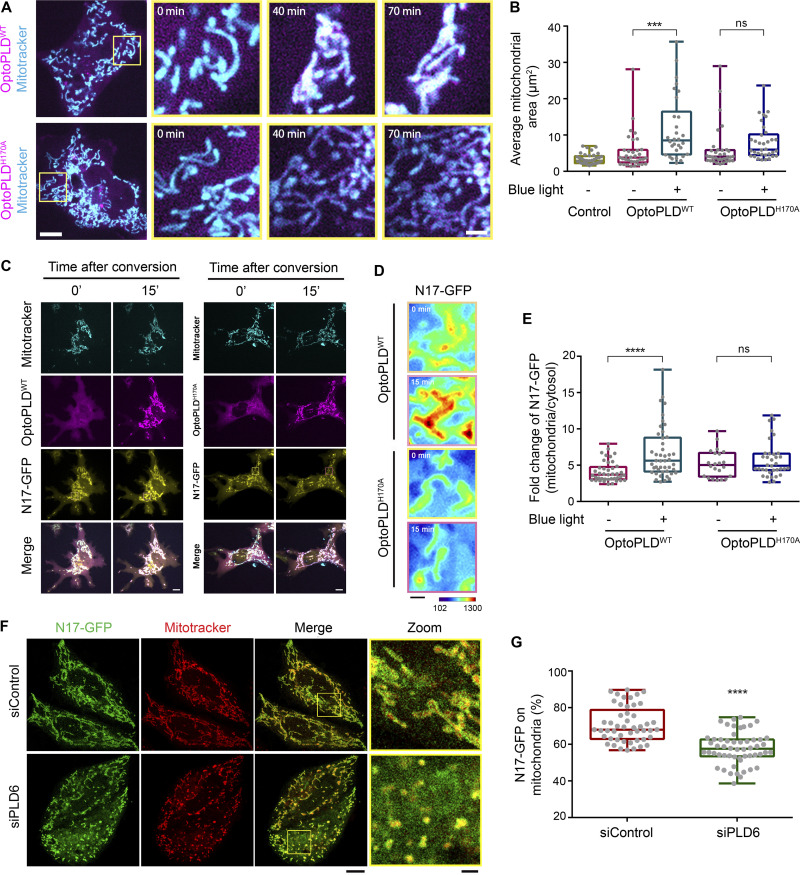
Mitochondrial PA is required for the subcellular location of N17-GFP. (A) The increase of mitochondrial PA by targeting optoPLDWT onto mitochondria induces their clustering. optoPLDWT or optoPLDH170A were transfected into Cos-7 cells, and these cells were stained with mitotracker deep red prior to conversion. After 70 min of blue-light-induced mitochondrial targeting by pulse with 90 s intervals, the effect of optoPLDWT on mitochondrial clustering was examined and quantified by the signal of mitotracker deep red. Scale bar, 10 μm. (B) Bar for inset image, 2 μm. The average mitochondrial area was quantified, compared to control cells, and shown in B. Each dot represents the average mitochondrial area of one cell. (C) optoPLDWT enhances the mitochondrial localization of N17-GFP. After the co-transfection of N17-GFP and optoPLDWT into Cos-7, the mitochondria were labeled with mitotracker deep red and subjected to blue-light conversion for 45 min. (D and E) Scale bar, 10 μm. The intensity of N17-GFP on mitochondria was monitored, magnified and shown (D), quantified and compared with optoPLDH170A by ImageJ (E). Bar for heatmaps, 2 μm. To quantify the mitochondrial targeting efficiency, the total intensity of N17-GFP on mitochondria in a cell was calculated by ImageJ and divided by the total N17-GFP intensity of a cell. Each dot represents the ratio of one cell. (F) PLD6 depletion reduces the mitochondrial localization of N17-GFP. The proportion of N17-GFP co-localized with mitotracker was measured in HeLa cells depleted with PLD6. Scale bar, 10 μm. Bar for inset images, 2 μm. (G) The mitochondrial localization efficiency of N17-GFP was quantified. Data are expressed as mean ± SD of at least three independent experiments and analyzed with one-way ANOVA. *P < 0.05; **P < 0.01; ***P < 0.001; ns, not significant.

