Figure 5.
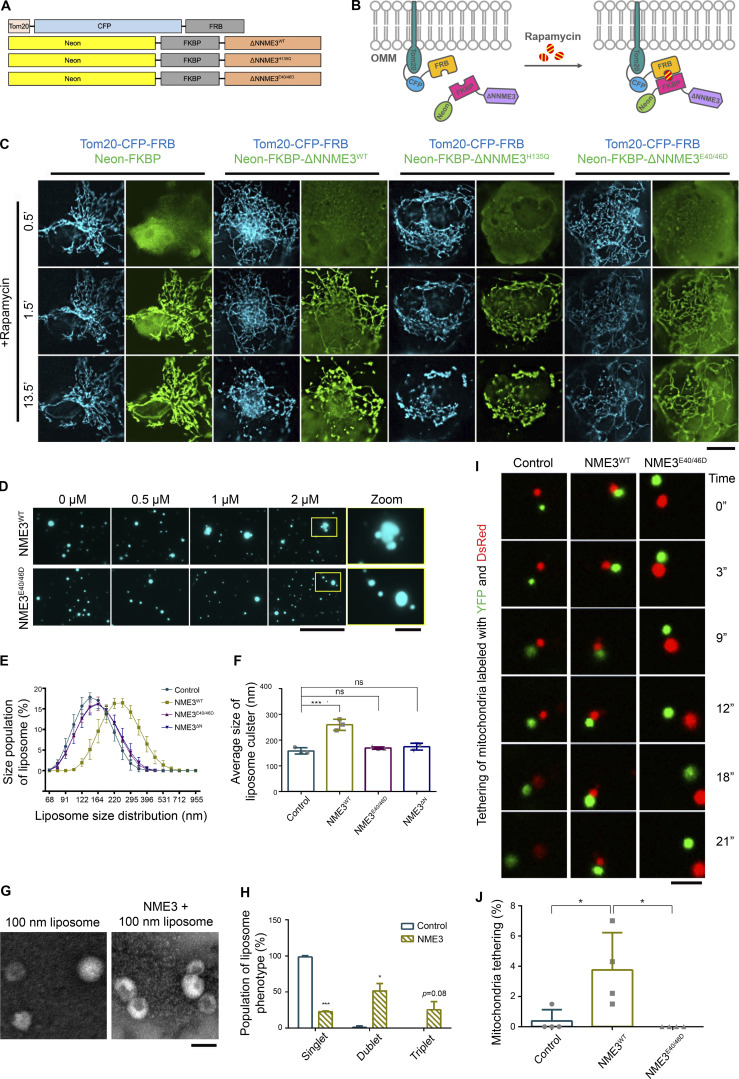
NME3 tethers liposomes or mitochondria into cluster. (A) NME3 constructs used in this rapamycin-induced mitochondrial targeting of NME3ΔN. (B) Scheme of the rapamycin-induced mitochondrial targeting assays. (C) Cos-7 cells co-transfected with Tom20-CFP-FRB and indicated Neon-FKBP-ΔNNME3 constructs were imaged upon rapamycin addition. Scale bar, 10 μm. (D) Liposome tethering assay. Purified NME3WT or NME3E40/46D were incubated with 10 μM liposome (20% DOPA:79% DOPC:1% rhodamine-PE) extruded from 1,000 nm pore size. After 30 min incubation, the distribution of liposome was imaged with fluorescent microscopy. Boxed areas were magnified and shown. Scale bar, 10 μm. Bar for inset images, 2 μm. (E) Dynamic light scattering assay. 20 μM, 100 nm liposomes were incubated with 2 μM indicated NME3 and analyzed with dynamic light scattering. (F) The distribution of liposome size was shown in E, and the average size of liposome were displayed in F. (G) Negative stain TEM of NME3WT-liposome cluster. (H) The population of liposome tethers was quantified. Bar, 200 nm. (I) Mitochondria tethering assay. The representative time-series images for mitochondria expressing different NME3-HA constructs. The DsRed-labeled mitochondria bound with YFP-labeled mitochondria for more than 15 s were considered stably tethered mitochondria. (J) The percentage of tethered mitochondria were quantified and shown in J. More than 200 mitochondria were count (n = 4). Scale bar, 5 μm. Data are expressed as mean ± SD of at least three independent experiments. *P < 0.05; ***P < 0.001; ns, not significant.

