
Figure 1. Spatial and temporal resolution of common neurophysiological techniques.
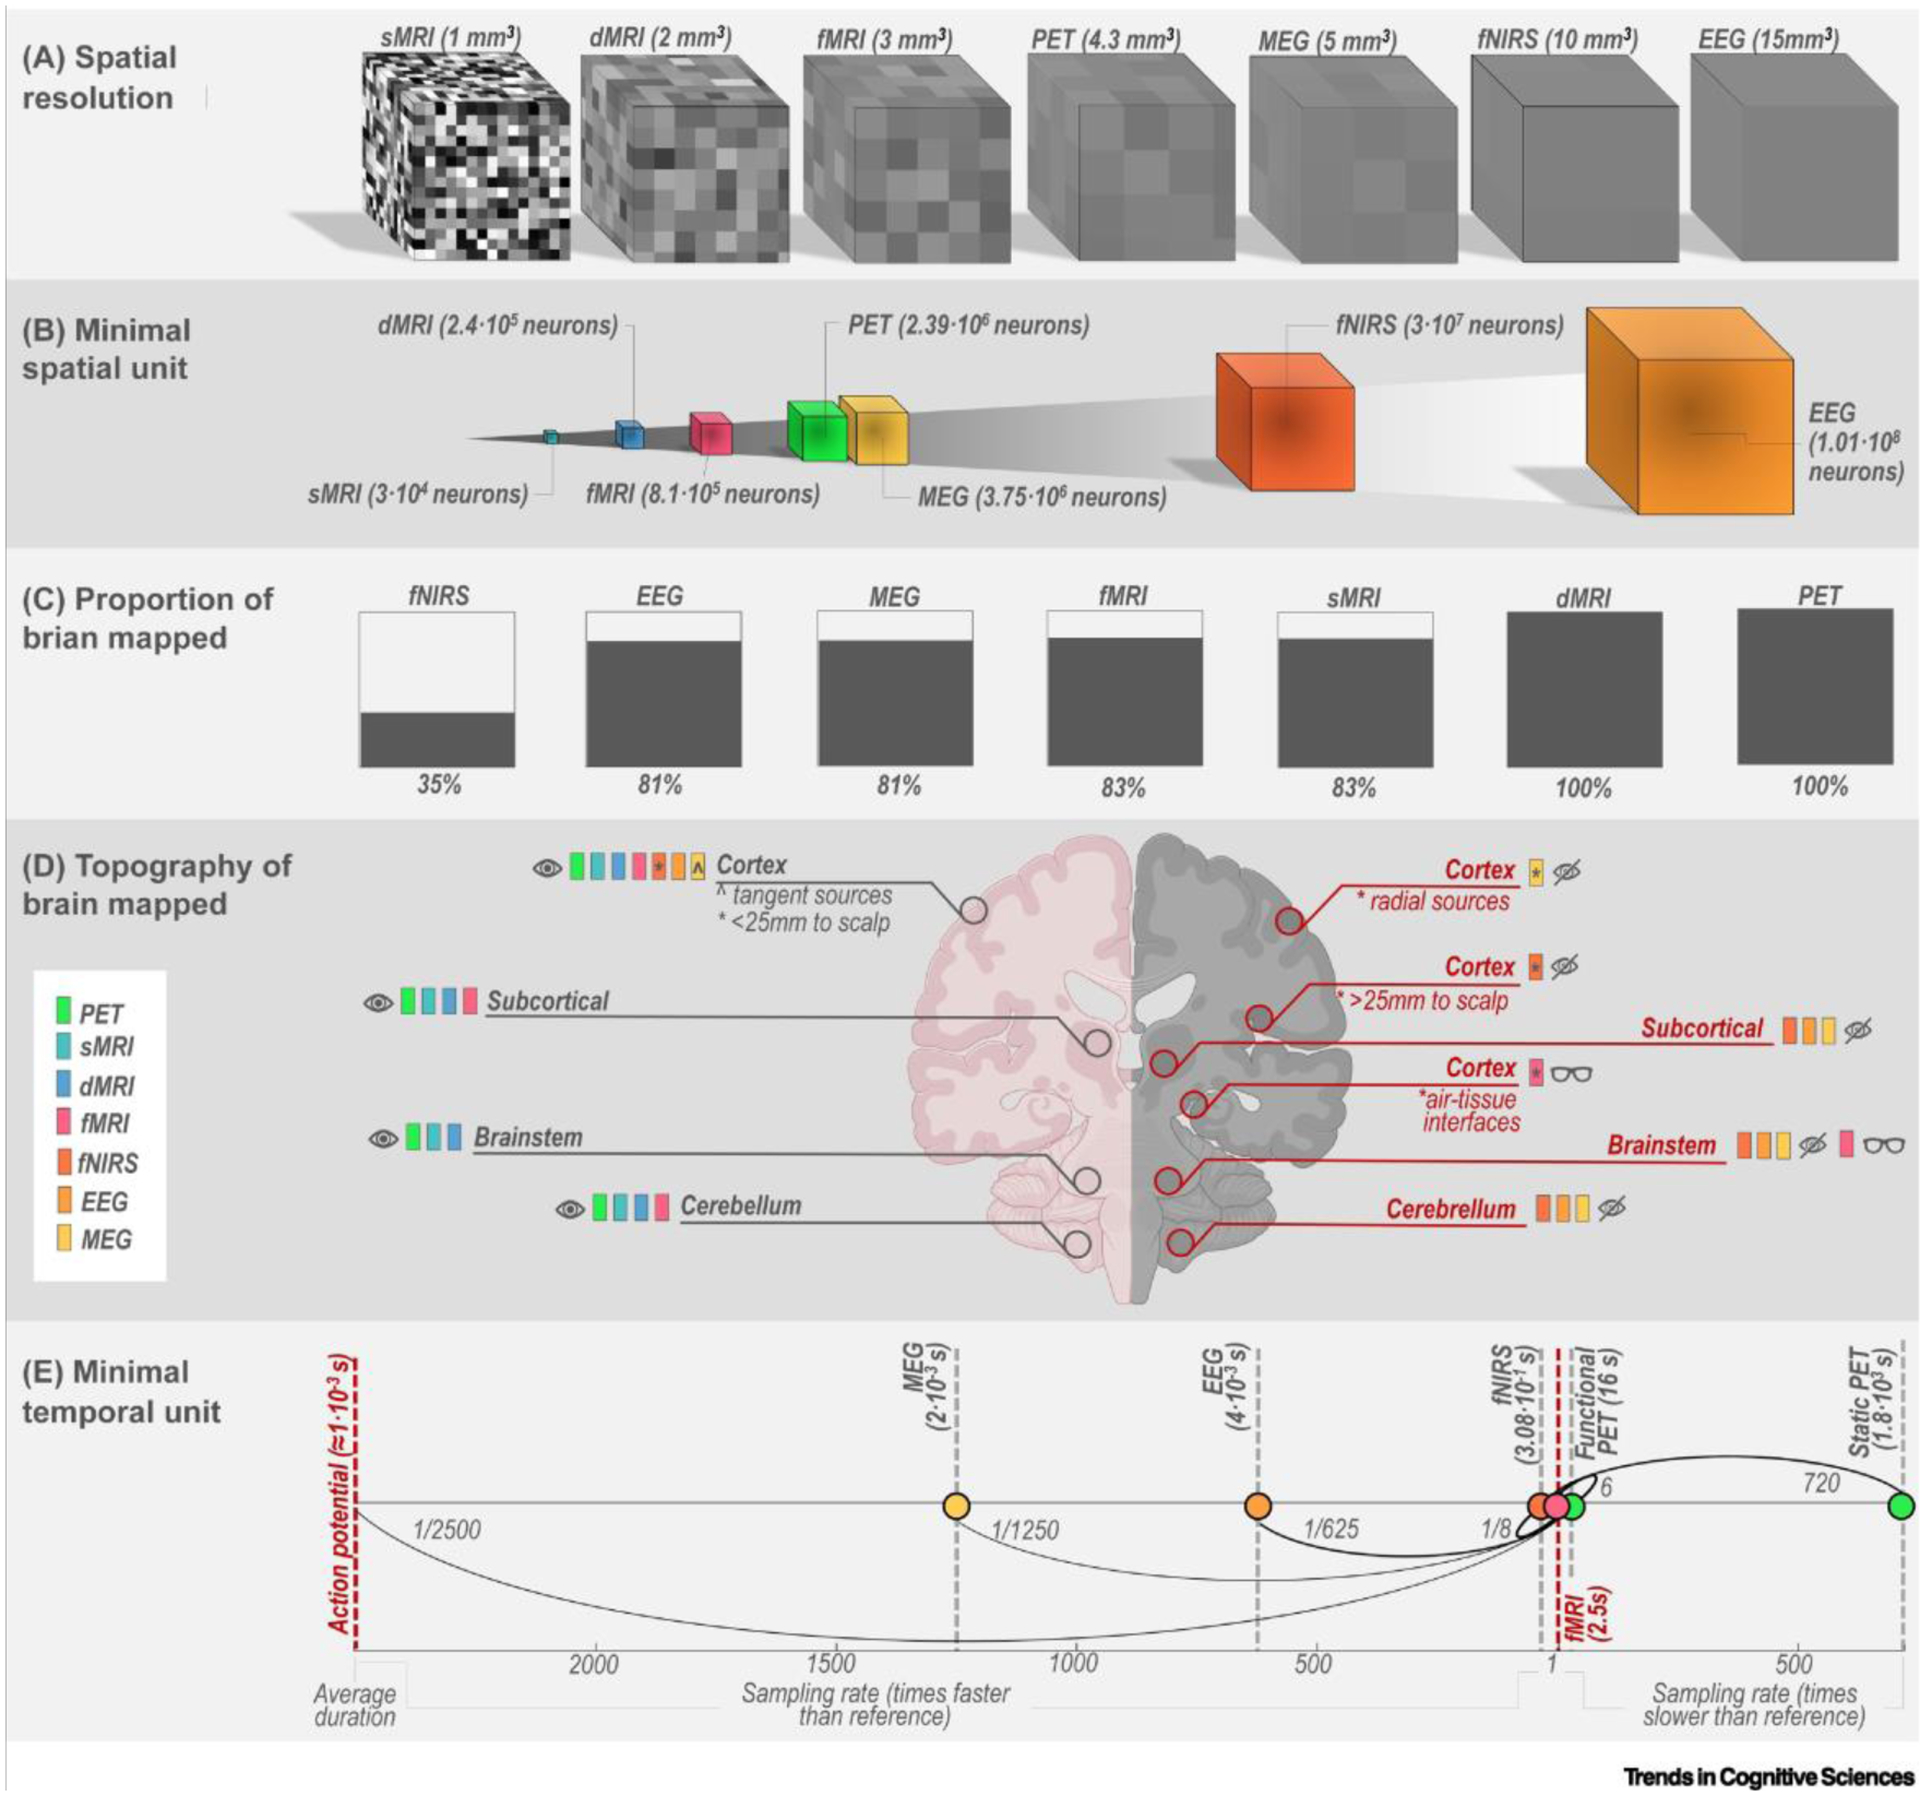
(A) Simulation of how a sample random object is resolved by each method. Spatial resolution is defined for sMRI, dMRI, and fMRI by voxel size, for PET and fNIRS by full width at half maximum (FWHM) [38,109], for EEG and MEG from [110]. For EEG and MEG the reported estimates are likely to be optimistic for functional connectivity studies [111]. Note that the values serve as a rough approximation. (B) The minimal spatial unit – expressed as the number of neurons – that each method can resolve, assuming 30 000 neurons/mm3. (C) Representation of the overall proportion of brain mapped by each method; lack of whole brain coverage by sMRI and fMRI is dependent on the distance factor, here assumed to be 20%.(D) Representation of different portions of the brain where signal is measured accurately (pink side, eye icon), is not measured (gray side, crossed eye icon), or is measured but with a lower resolution and/or susceptibility artifacts (gray side, glasses icon). This part of the figure was created in part with BioRender.com.(E) Average sampling rate of each method, based on an adjusted logarithmic scale centered around an fMRI sampling rate of 2.5 s. The timescale of PET is shown under the case of static PET and functional PET. Note that the values serve as a rough approximation. Action potentials with an assumed duration of 1 ms are reported for reference. Abbreviations: dMRI, diffusion magnetic resonance imaging; EEG, electroencephalography; fNIRS, near-infrared spectroscopy; fMRI, functional magnetic resonance imaging; MEG, magnetoencephalography; PET, positron emission tomography; sMRI, structural magnetic resonance imaging.