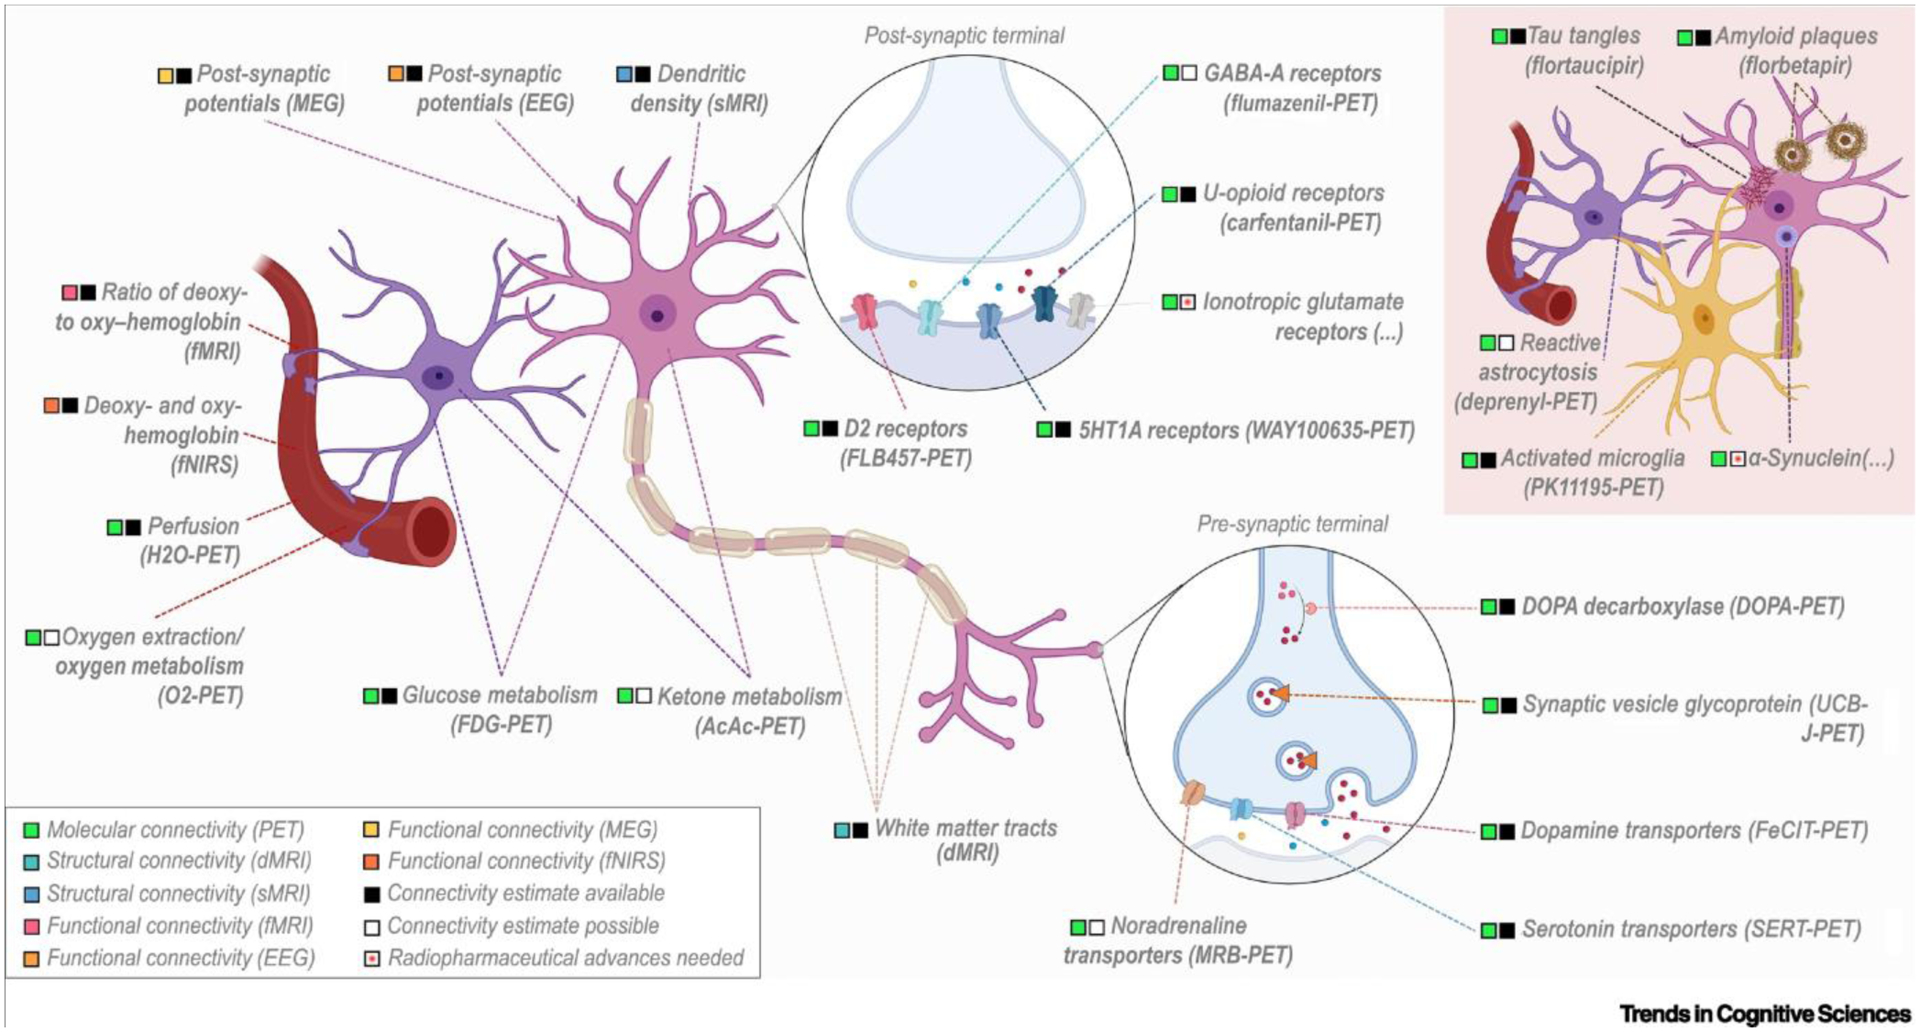
Figure 2. Targets and connectivity estimates of common neurophysiological techniques.

Schematic representation of the main neurobiological targets measured by each neurophysiological technique, and their localization in the brain parenchyma (astrocytes, neurons) or blood vessels. Neurobiological targets found only in pathological conditions are also shown (red panel, top right). The type of connectivity estimate obtained for each neurobiological target is noted, and is color-coded for each technique. Connectivity estimates are considered to be available if at least one study has been published in a peer-reviewed scientific journal, and to be possible if there are no studies but an appropriate positron emission tomography (PET) radiotracer is available; radiopharmaceutical advances are needed if an appropriate PET radiotracer remains under development. This figure was created in part with BioRender.com.
