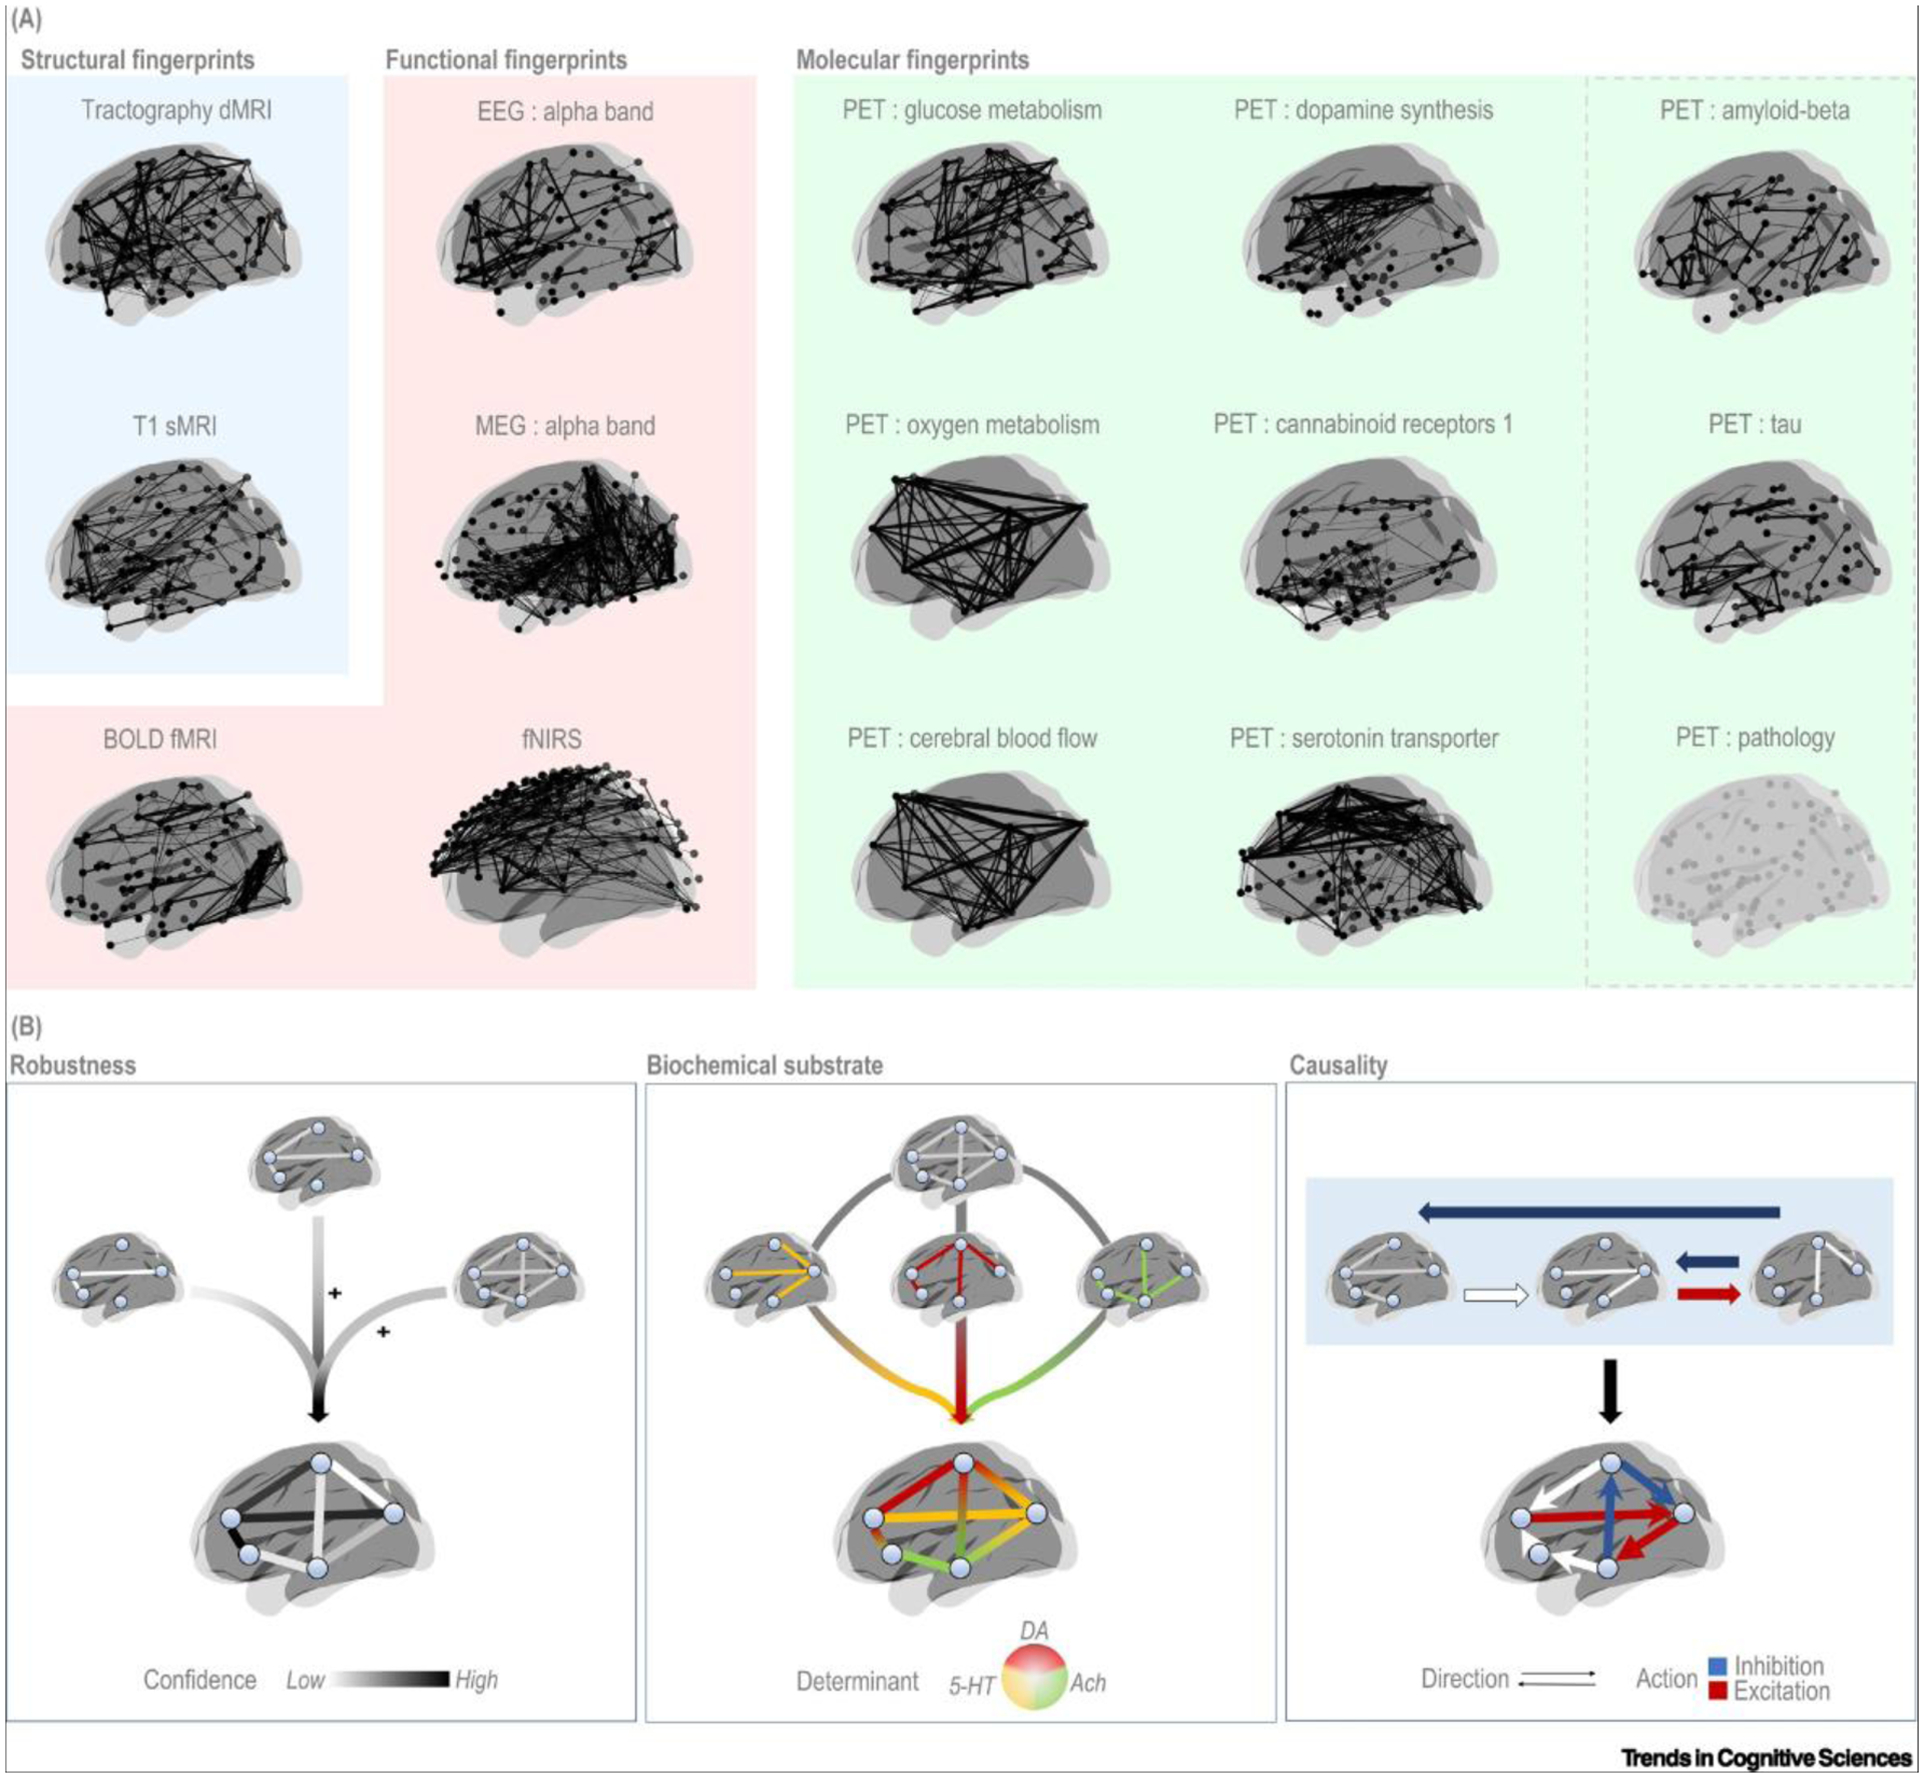
Figure 3. Brain connectomes as estimated with common neurophysiological techniques and scenarios of their integration.

(A) All connectomes refer to group-level maps, with the exception of the EEG and MEG connectomes that are estimated at the single-subject level. All connectomes are based on data from healthy subjects. In each connectome, nodes correspond to brain regions, with the exception of the fNIRS connectome in which nodes correspond to channels on the scalp. The PET pathology render represents an outline of a prototype connectome for any pathological target. (B) Scenarios of integration across connectomes. Integration of molecular connectivity can increase the robustness of connectivity estimates (Left), specify the biochemical determinants underlying a given connection (middle), or clarify the directionality and, eventually, the type of action exerted along each connection (red, blue arrows) (Right). All renders were created using BrainNet [112]. Abbreviations: Ach, acetylcholine; DA, dopamine; 5-HT, serotonin; dMRI, diffusion magnetic resonance imaging; EEG, electroencephalography; fMRI, functional magnetic resonance imaging; fNIRS, near-infrared spectroscopy; MEG, magnetoencephalography; PET, positron emission tomography; sMRI, structural magnetic resonance imaging.
