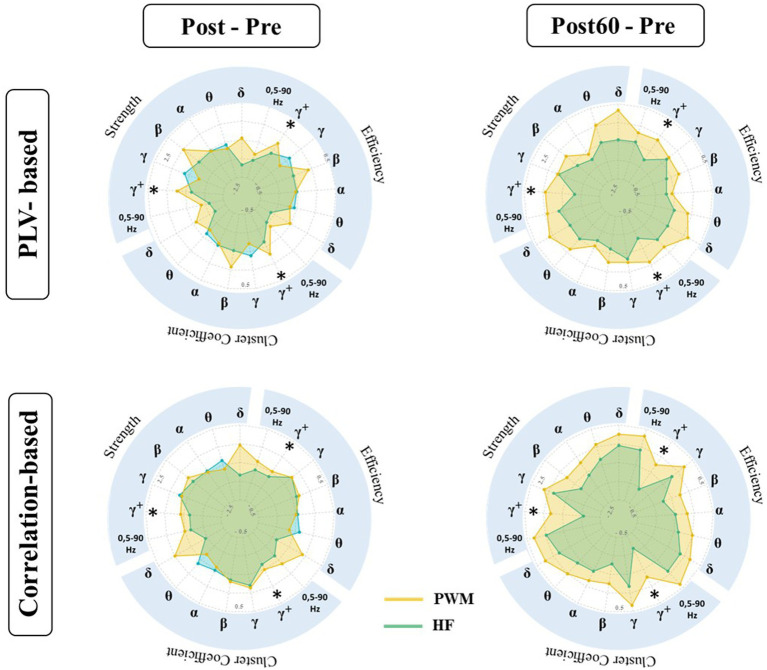
Figure 3.
Local characteristics of functional brain network extracted from PLVFC (top row) and CorFC (bottom row) in high gamma-band. Each radar plot represents changes in local indexes by interventions (PWM: orange area and HF: blue area) compared to Pre value (Post – Pre and Post60 – Pre) for each ROIs. Brain regions with significantly different induced changes by two interventions are depicted by *.

