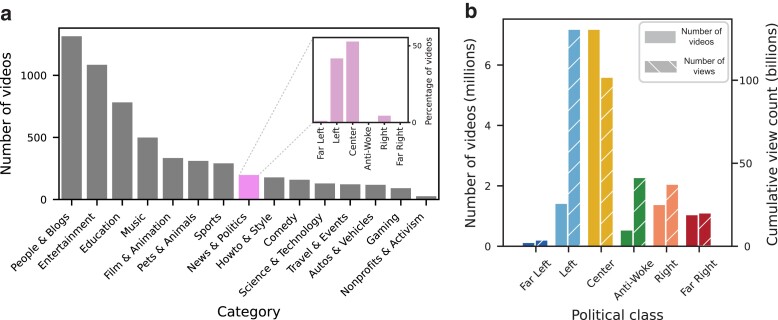
Fig. 2.
Baseline recommendations and dataset description. (a) A summary of the categories and political classes of the videos recommended to new users. The main plot illustrates the number of videos from each category for the videos recommended to new users. The inset illustrates the distribution of political classifications for videos falling under the “News & Politics” category. (b) The number of videos (left y-axis) and cumulative number of views (right y-axis) across political classes for all videos in the dataset.

