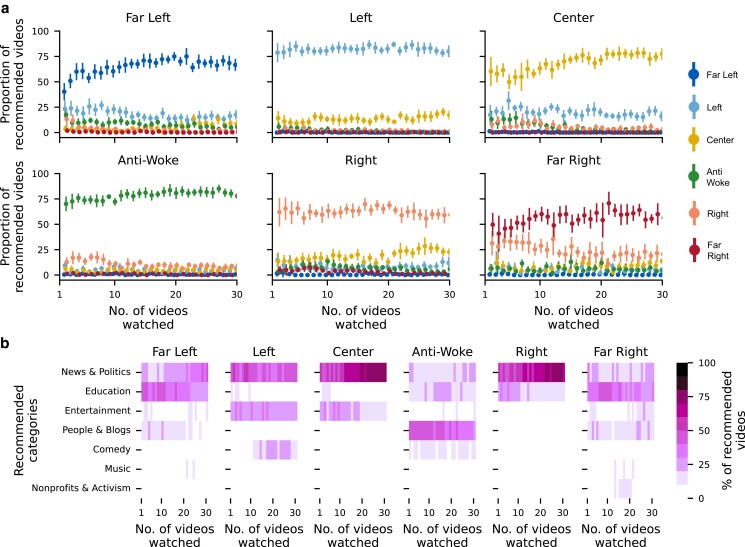
Fig. 3.
Distribution of recommendations made after watching videos of a particular political class. (a) Proportion of recommended videos falling under each political class after each video is watched, with error bars representing 95% confidence intervals. The proportions of videos falling under each political class after each video watched sum up to 100%. (b) Category distribution of recommended videos after each video is watched, where the proportion of videos falling under each category sum up to 100%. The title of each plot indicates the political classification of the videos being watched.

