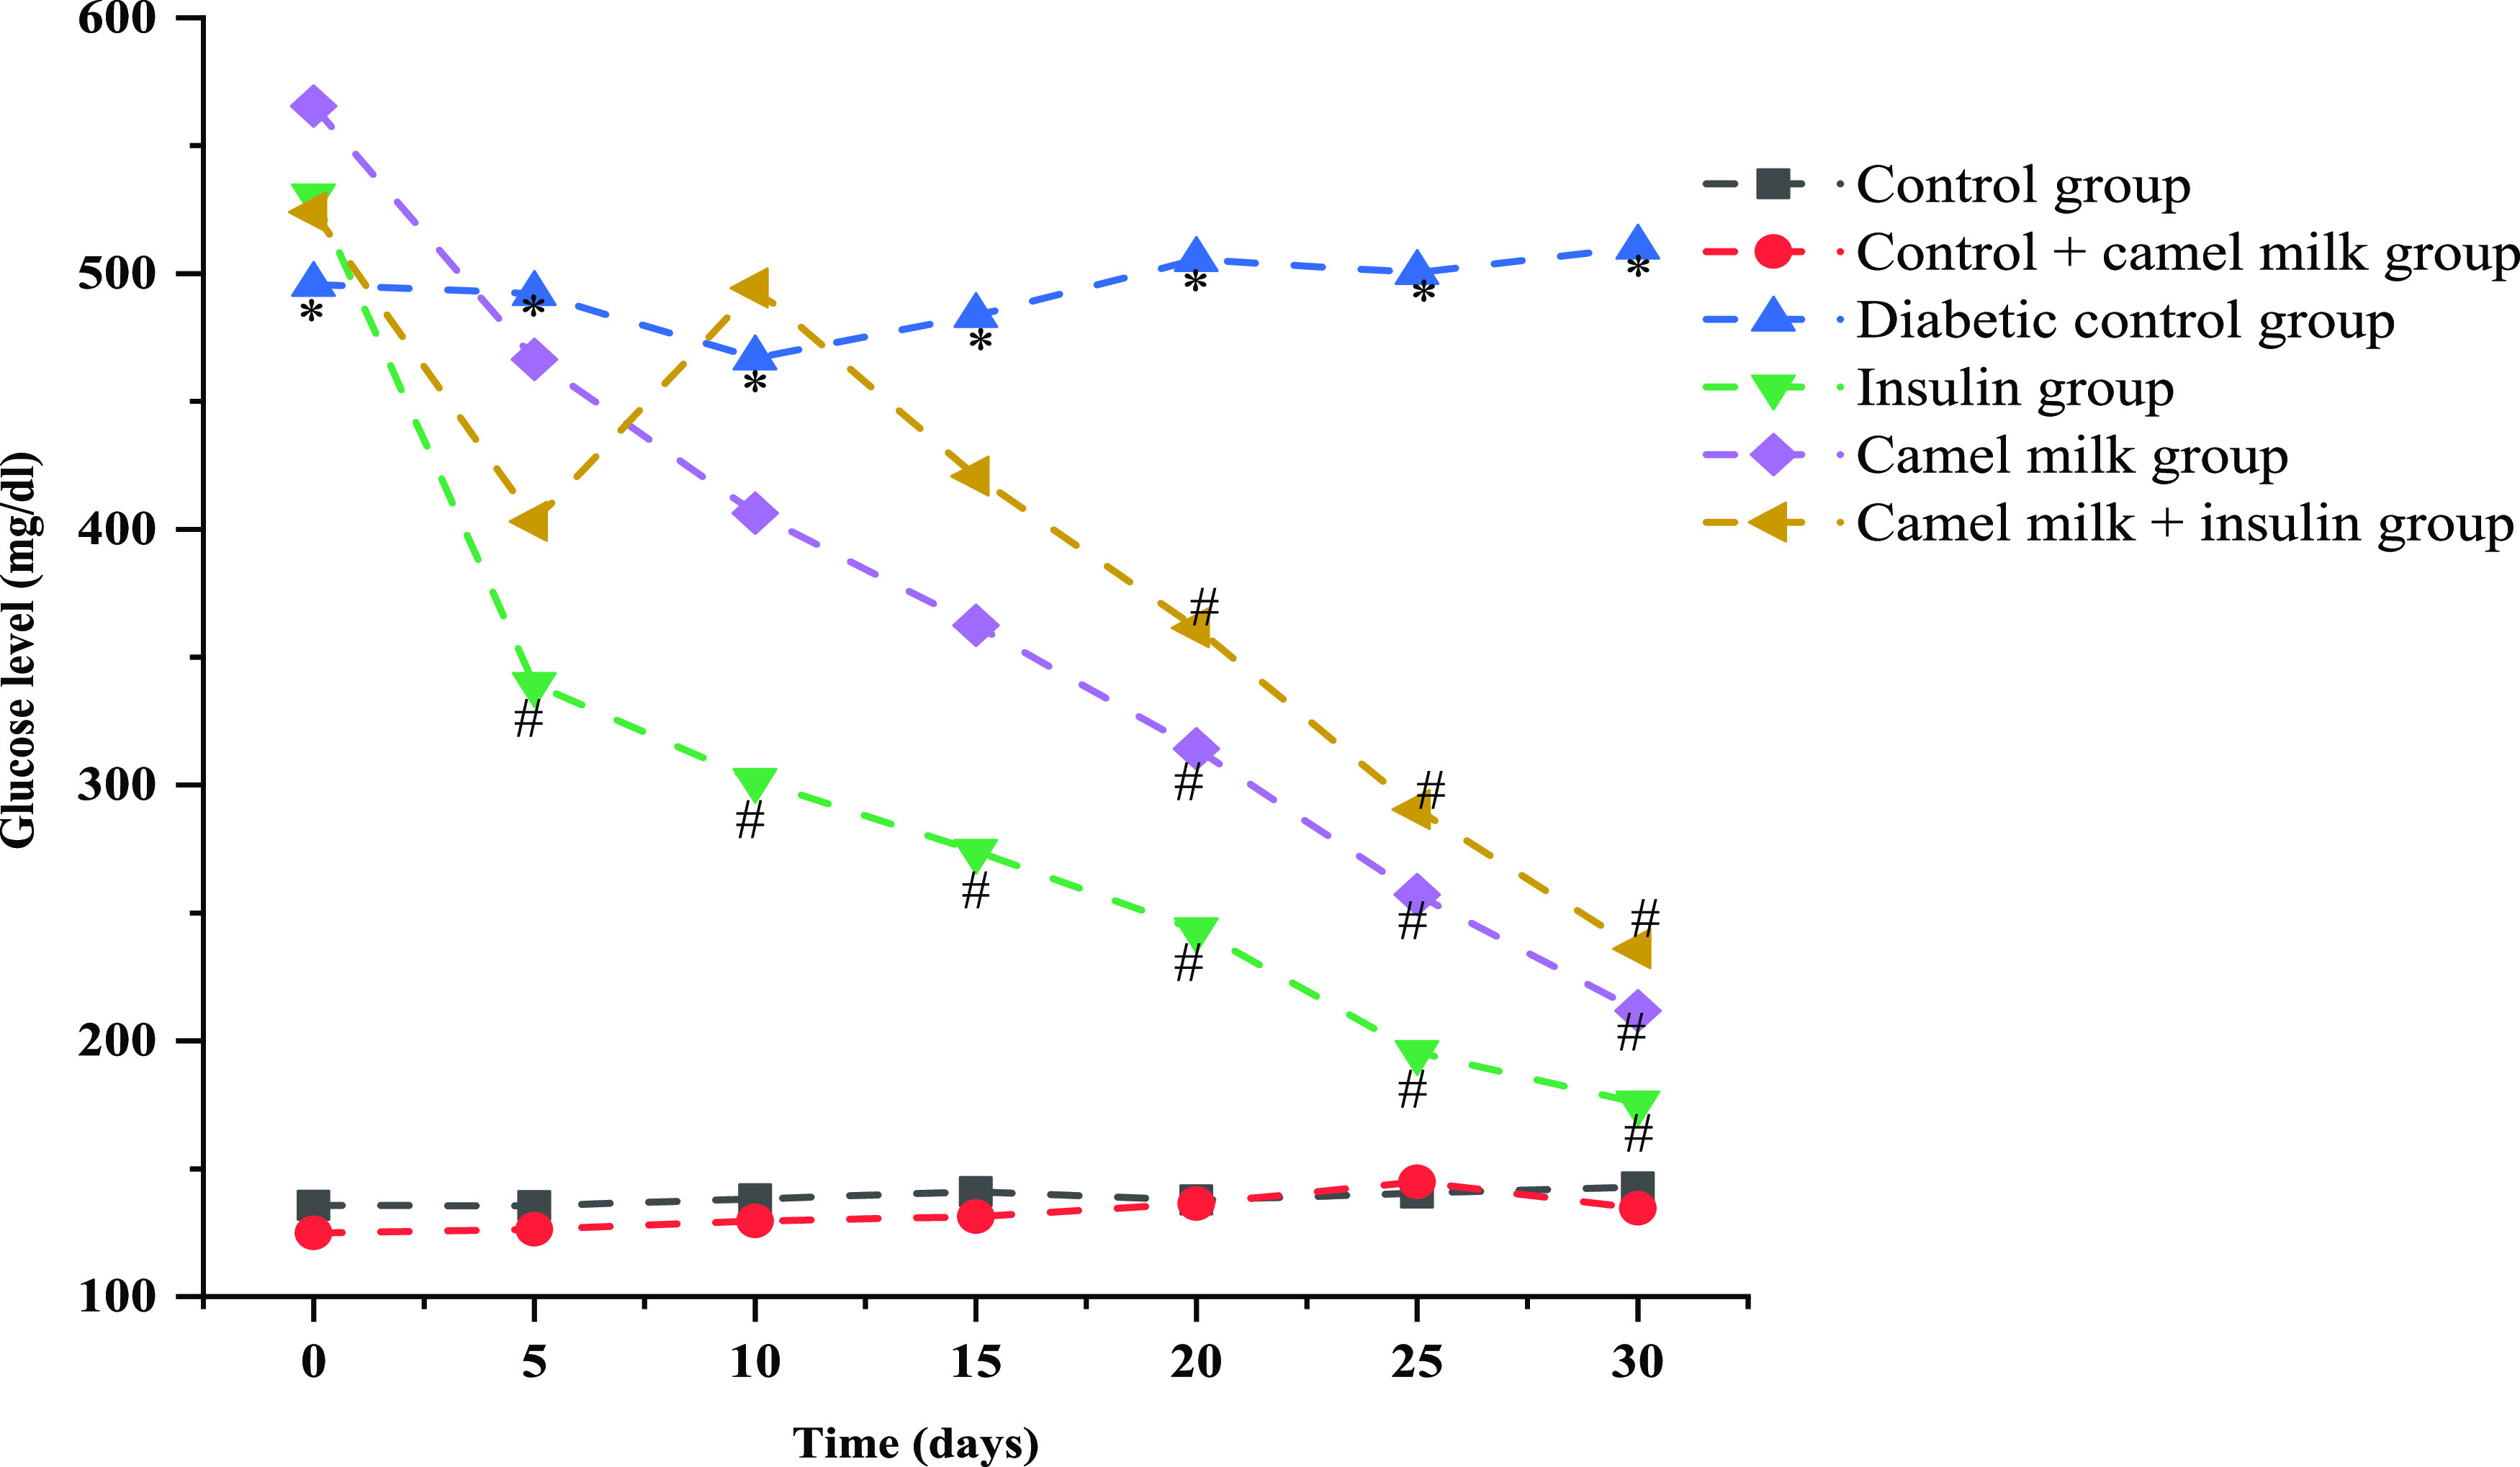
Figure 3.

Effect of camel milk and insulin solely and in combination on blood glucose levels (mg/dL) in different experimental groups during the treatment period. Data are mean ± SD; N = 6; significant at 5% for ANOVA. Here, * represents significance in comparison to control, and # represents significance in comparison to diabetic control (P value represented with * /# ≤0.05).
