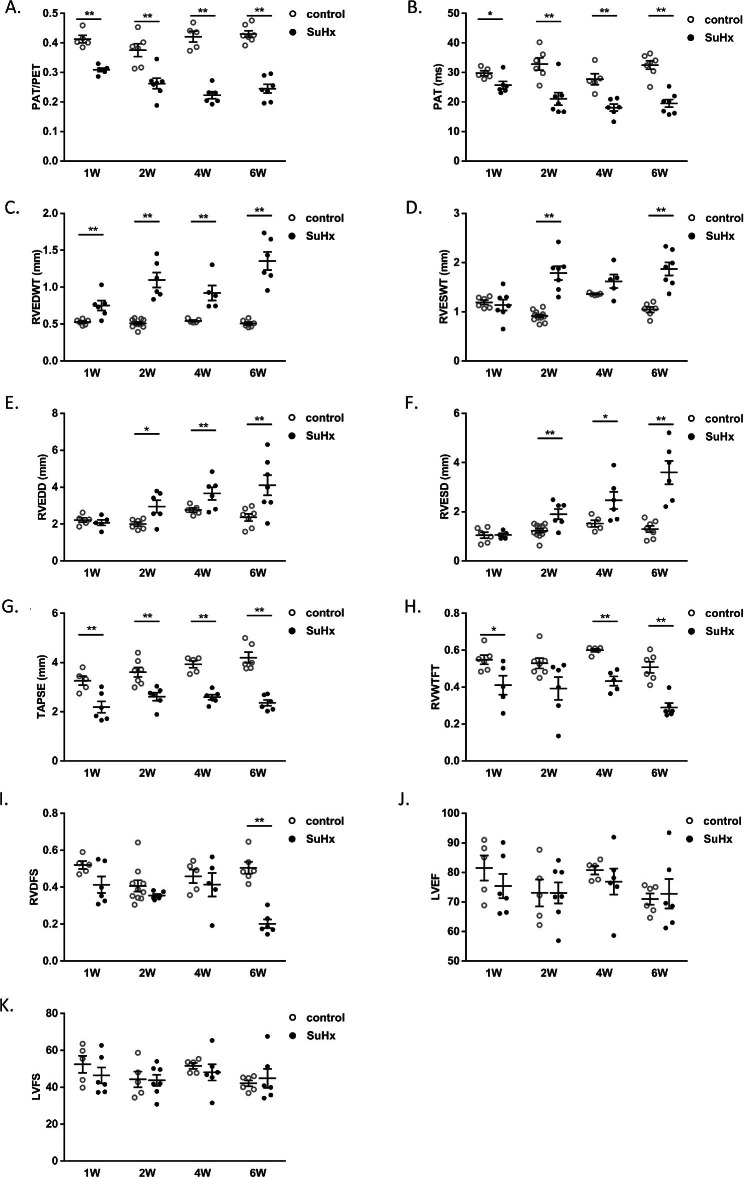
Fig. 3.
Dynamic changes in echocardiographic measurements of SuHx rats. Scatter dot plots showing the echocardiographic indexes including PAT/PET ratios (A), PAT (B), RVEDWT (C), RVESWT (D), RVEDD (E), RVESD (F), TAPSE (G), RVWTFT (H), RVDFS (I), LVEF (J), and LVFS (K) the two groups. Data were presented as mean ± S.E.M., control group n = 5–7, SuHx group n = 6–7, *P < 0.05, **P < 0.01, compared with the control group. PAT: Pulmonary acceleration time; PAT/PET: the ratio of PAT/pulmonary ejection time; RVEDWT: RV end-diastolic free-wall thickness; RVESWT: RV end-systolic free-wall thickness; RVEDD: RV end-diastolic diameter; RVESD: RV end-systolic diameter; TAPSE: Tricuspid annular plane systolic excursion; RVWTFT: RV free-wall thickness fractional thickening; RVDFS: RV diameter fractional shortening; LVEF: left ventricular ejection fraction; LVFS: left ventricular ejection fraction; W: week

