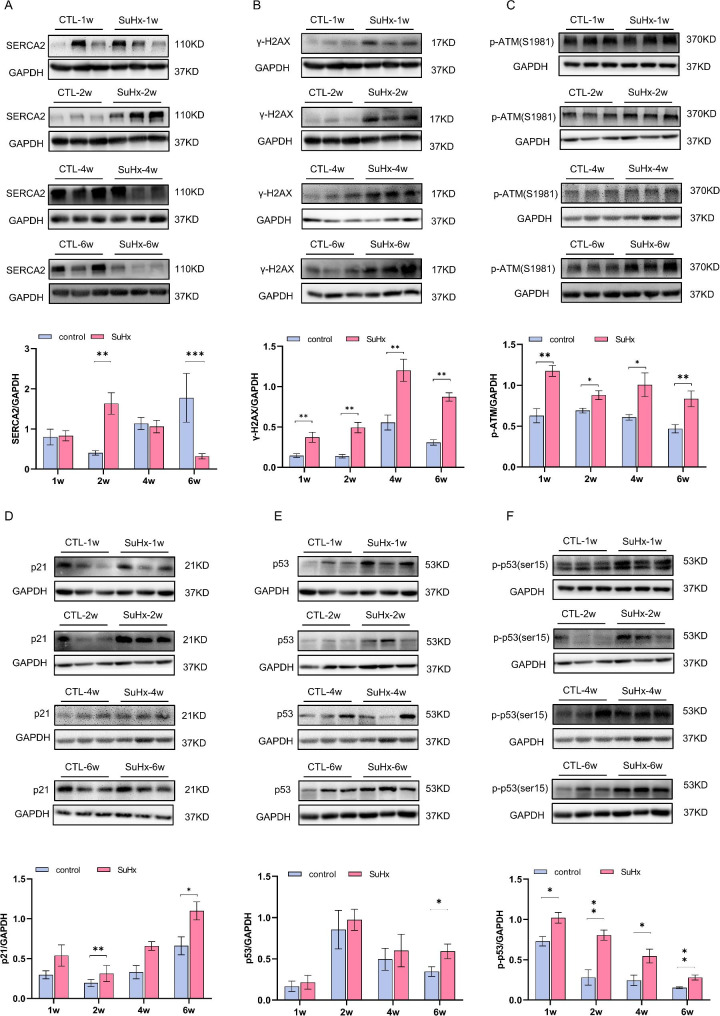
Fig. 5.
Changes in expression level of myocardial damage and DNA damage related proteins in RV tissue of SuHx rats. (A) Representative blots for (A) SERCA2, (B) γ-H2AX, (C) p-ATM, (D) p21, (E) p-p53, p53 and GAPDH. Mean intensity for SERCA2, γ-H2AX, p-ATM, p21, (F) p-p53 and p53 blots relative to GAPDH. Data were presented as mean ± S.E.M., control group n = 5–7, SuHx group n = 6–7, *P < 0.05, **P < 0.01, compared with the control group. The gel images shown are cropped from the full-length blot images which were shown in additional file 1. W: week

