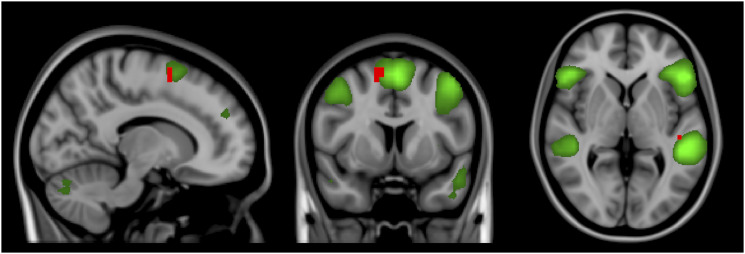
Figure 4.
Independent component analysis map of the ventral attention network in green on a 1-mm MNI152 standard brain, for visual purpose. Corrected RS-fMRI maps in the sagittal, coronal, and axial planes that compare MS patients not using natalizumab vs MS patients using natalizumab. Red voxels represent areas with increased connectivity in the MS group not using natalizumab compared to the MS group using natalizumab. These areas are present in the left Heschl’s gyrus and the right superior frontal gyrus.

