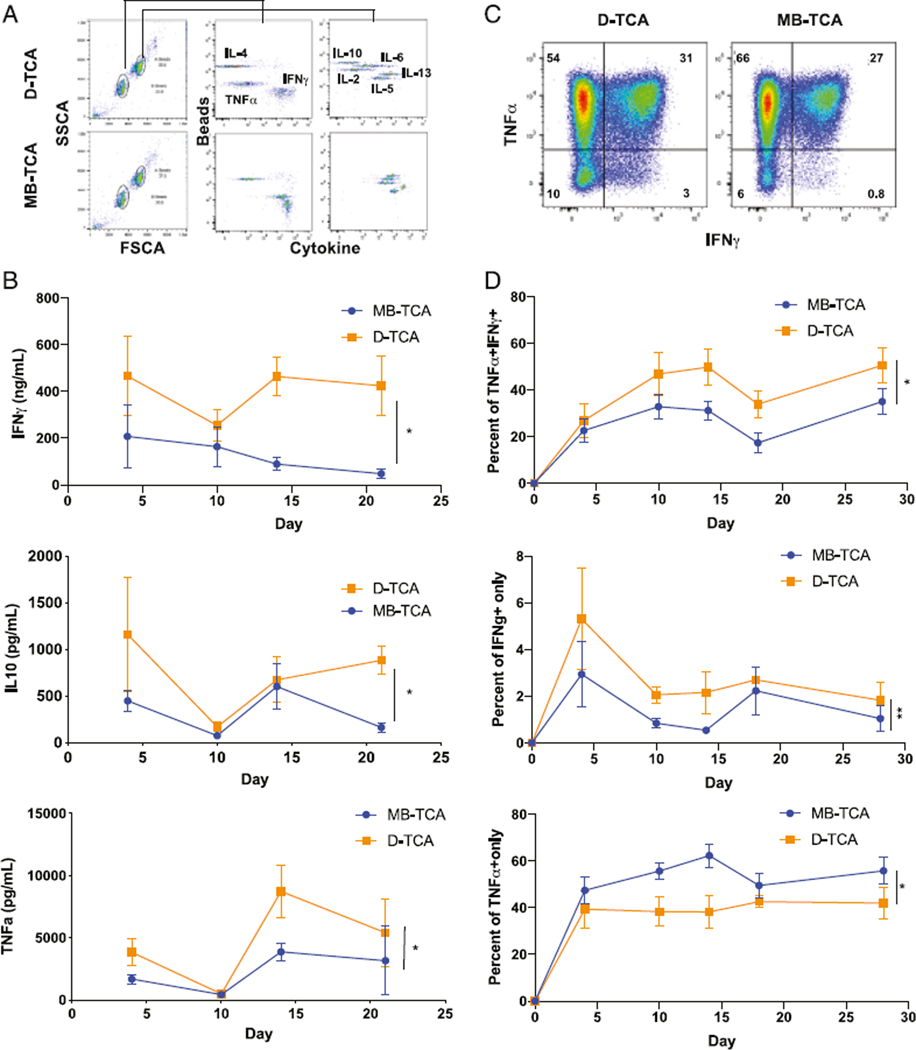
FIGURE 3. Cytokine levels in culture supernatants and inside of naive CD4+ T cells after stimulation with either D-TCA or MB-TCA.
(A) Representative graph of cytokine levels by LEGENDplex method. A total of eight cytokines were measured as indicated. (B) Level of IFN-γ, IL-10, and TNF-α in culture supernatants of a 24-d course by either D-TCA or MB-TCA. Average values of 12 subjects are shown. (C) Representative graph of flow cytometry analysis of IFN-γ and TNF-α intracellular expression in stimulated naive CD4+ T cells. (D) Average percentages of cells producing both IFN-γ and TNF-α, or only IFN-g or TNF-a (n = 8). Comparison between D-TCA and MB-TCA was done by LME model. *p < 0.05, **p < 0.01.

