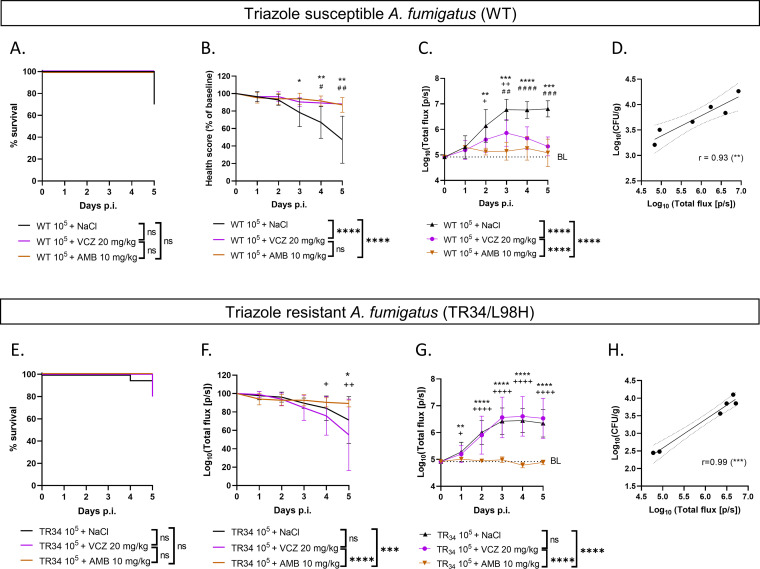
FIG 5.
Antifungal screening of triazole-susceptible and -resistant AF strains in the G. mellonella infection model. Shown are survival rates, health scores, BLI signals, and endpoint correlations between in vivo BLI signals and the respective CFU of larvae infected with 105 conidia of wild-type (WT) (triazole-susceptible) Aspergillus fumigatus (A to D, respectively) and larvae infected with 105 conidia of AF TR34/L98H (triazole-resistant A. fumigatus) (E to H, respectively) over 5 days after infection. BL (baseline) represents the background signal (dotted lines in panels C and G). r, Pearson correlation coefficient. Data are means (±SD) (n = 10 for all longitudinal data; n = 2 per group for endpoint correlations). Statistics on the graph refer to differences on individual days between voriconazole (VCZ)- and amphotericin (AMB)-treated (“+”), between AMB- and NaCl-treated (“*”), and between VCZ- and NaCl-treated (“#”) larvae. Statistics in the keys refer to longitudinal differences over 5 days. */#/+, P < 0.05; **/##/++, P < 0.01; ***/###/+++, P < 0.001; ****/####/++++, P < 0.0001; ns, nonsignificant.

