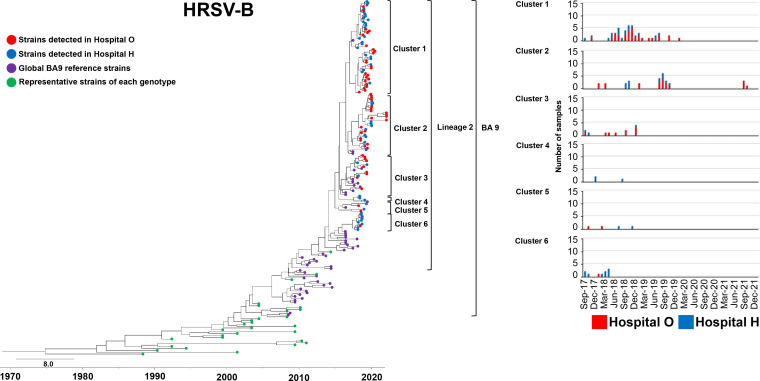
FIG 3.
Time-scaled maximum clade credibility tree using the best model (GTR model) of the second HVR of G from HRSV-B constructed using the Bayesian MCMC method under the exponential molecular clock. A 10-year timeline is shown below the tree. Strains detected at hospital O are shown in red, and those detected at hospital H are shown in blue. Strains circulating in different countries are shown in purple. Representative strains of each genotype are shown in green. On the right are the number and detection time of HRSVs detected in each cluster at hospitals O and H.

